The Economics and Statistics Division maintains archives of previous publications for accountability purposes, but makes no updates to keep these documents current with the latest data revisions from Statistics Canada. As a result, information in older documents may not be accurate. Please exercise caution when referring to older documents. For the latest information and historical data, please contact the individual listed to the right.
<--- Return to Archive
For additional information relating to this article, please contact:
July 02, 2020NOVA SCOTIA - INTERNATIONAL MERCHANDISE TRADE MAY 2020 During the COVID-19 pandemic, comparisons of year-to-date averages and sums do not show Nova Scotia’s rapidly changing economic situation. The DailyStats will focus on year-over-year comparisons, comparing one month with the same month in the prior year. Where possible the DailyStats will make comparisons of seasonally adjusted data from the pre-COVID-19 period (January and February 2020) with the period during which COVID-19 measures were in place from March 2020 onwards.
Year-over-year (May 2020 vs May 2019, customs based, unadjusted)
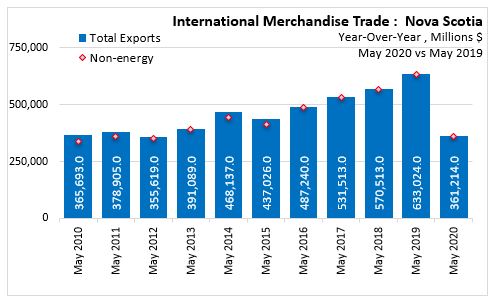
In May 2020, Nova Scotia International Merchandise Trade Exports decreased 42.9% ($271.8 million) over May 2019, to $361.2 million.
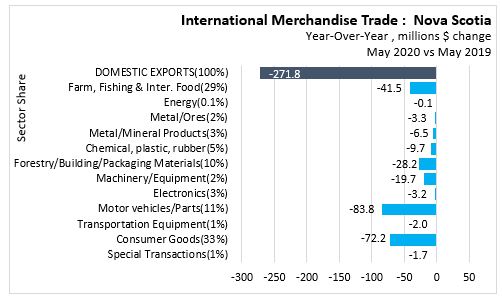
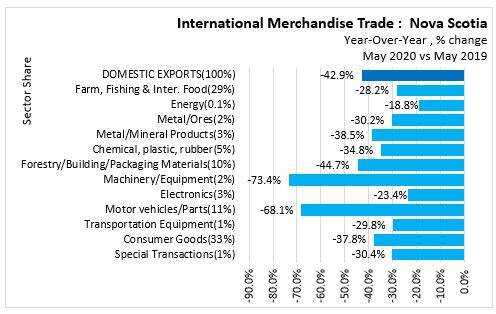
Year-over-year - By Sector
Comparing Nova Scotia's exports for May 2020 with the same period last year, all sectors were in decline. The smallest dollar value declines were in Energy (-$0.1 million), Special Transactions (-$1.7 million), and Transportation Equipment (-$2.0 million). The largest dollar value decreases were in Motor vehicles/Parts (-$83.8 million), Forestry/Building/Packaging Materials (-$72.2 million), and Machinery/Equipment (-$41.5 million).
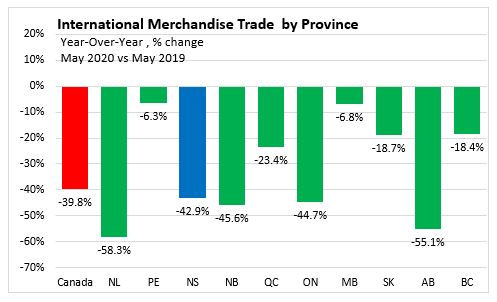
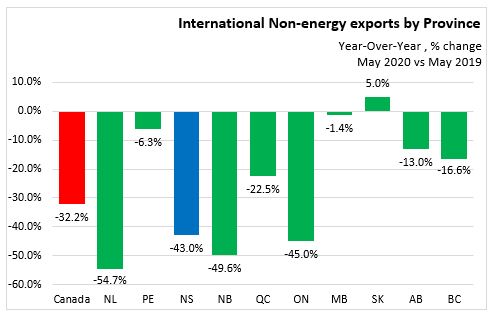
Year-over-year by Province
In May 2020 Prince Edward Island reported the lowest decline (-6.3%), while Newfoundland and Labrador reported the highest decline (-58.3%) in merchandise trade exports over May 2019. Nova Scotia reported a 42.9% loss in merchandise trade exports. Canada reported a 39.8% loss in merchandise trade exports over May 2019.
Excluding energy exports, Saskatchewan reported the highest increase (+5.0%) while Newfoundland and Labrador reported the highest decline (-54.7%) in Non-energy exports over May 2019. Nova Scotia reported a 43.0% loss in Non-energy exports. Canada reported a 32.2% loss in Non-energy exports over May 2019.
YEAR-OVER-YEAR EXPORTS BY INTERNATIONAL DESTINATION
By Commodity
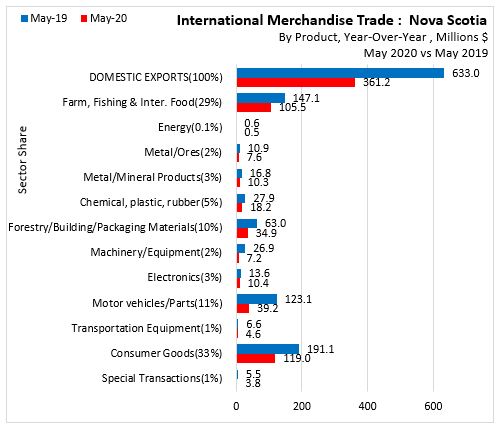
In Nova Scotia May 2020, international export trade to all countries decreased 42.9 to $361.2 million over May 2019.
- Consumer Goods led the way with a value of $119.0 million (32.9% share), followed by
- Farm, Fishing & Inter. Food with a value of $105.5 million (29.2% share),
- Motor vehicles/Parts with a value of $39.2 million (10.9% share),
- Forestry/Building/Packaging Materials with a value of $34.9 million (9.6% share),
- Chemical, plastic, rubber with a value of $18.2 million (5.0% share),
- Electronics with a value of $10.4 million (2.9% share),
- Metal/Mineral Products with a value of $10.3 million (2.9% share),
- Metal/Ores with a value of $7.6 million (2.1% share),
- Machinery/Equipment with a value of $7.2 million (2.0% share),
- Transportation Equipment with a value of $4.6 million (1.3% share),
- Special Transactions with a value of $3.8 million (1.1% share), and ,
- Energy with a value of $0.5 million (0.1% share).
By Trading Partner
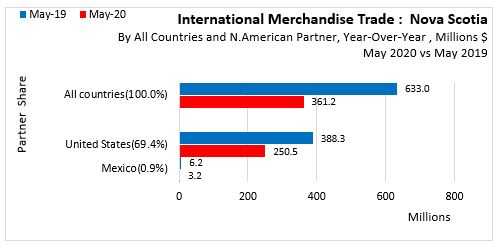
In North America, May 2020 vs May 2019, year-over-year export trade to the United States decreased 35.5% (-$137.8 million) to $250.5 million. Mexico decreased 48.9% (-$3.0 million) to $3.2 million.

In Asia, May 2020 vs May 2019, year-over-year export trade to China decreased 56.3% (-$61.9 million) to $48.1 million. Japan down 19.2% (-$1.5 million) to $6.4 million; South Korea down 43.7% (-$5.3 million) to $6.9 million; Hong Kong down 84.7% (-$21.5 million) to $3.9 million; India down 76.2% (-$3.2 million) to $1.0 million; Taiwan down 28.5% (-$0.4 million) to $1.0 million; Indonesia down 100.0% (-$7.7 million) to $0.00 million; Singapore down 93.9% (-$3.4 million) to $0.2 million.

In Europe, May 2020 vs May 2019, year-over-year export trade to the United Kingdom down 59.4% (-$3.7 million) to $2.5 million; Germany down 7.8% (-$0.4 million) to $4.9 million; Italy up 83.6% ($1.3 million) to $0.3 million; France down 34.9% (-$2.0 million) to $3.8 million; Netherlands up 43.6% (-$3.3 million) to $4.3 million; Belgium down 44.5% (-$1.9 million) to $2.3 million; Spain down 77.1% ($0.9 million) to $0.5 million; Norway up 90.1% ($0.9 million) to $1.9 million; Switzerland down 64.7% (-$0.6 million) to $0.3 million; Russian Federation up 147.5% ($0.2 million) to $0.39 million.
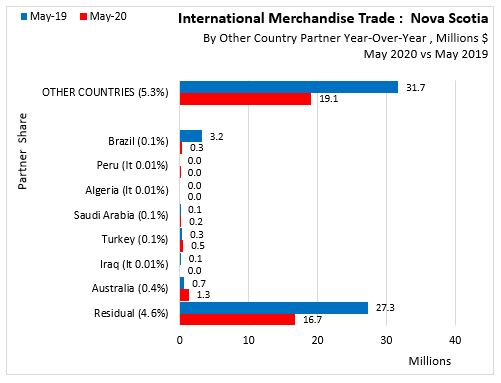
In other countries, May 2020 vs May 2019, year-over-year export trade to Brazil down 89.5% (-$2.9 million) to $0.3 million; Peru up less than 0.01% ($0.01 million) to $0.01 million; Algeria up less than 0.01%; Saudi Arabia up 309.3% ($0.17 million) to $0.2 million; Turkey up 49.3% ($0.2 million) to $0.5 million; Iraq down less than 0.01% (-$0.1 million) to zero; Australia up 96.2% ($0.631 million) to $1.29 million; Residual down 38.7% (-$10.6 million) to $16.7 million.
12-10-0119-01 International merchandise trade: Nova Scotia sectors
12-10-0119-01 International merchandise trade: by province and commodity
12-10-0119-01 International merchandise trade: by province and energy commodity
12-10-0119-01 International merchandise trade: by province, commodity, trading partners
Trading partners group 1: All, US, China
Trading partners group 2: Japan et al
Trading partners group 3: UK et al
Trading partners group 4: Mexico et al
<--- Return to Archive