The Economics and Statistics Division maintains archives of previous publications for accountability purposes, but makes no updates to keep these documents current with the latest data revisions from Statistics Canada. As a result, information in older documents may not be accurate. Please exercise caution when referring to older documents. For the latest information and historical data, please contact the individual listed to the right.
<--- Return to Archive
For additional information relating to this article, please contact:
July 02, 2020CANADA TRADE BALANCE, MAY 2020 During the COVID-19 pandemic, comparisons of year-to-date averages and sums do not show Nova Scotia’s rapidly-changing economic situation. The DailyStats will focus on year-over-year comparisons, comparing one month with the same month in the prior year. Where possible the DailyStats will make comparisons of seasonally adjusted data from the pre-COVID-19 period (January and February 2020) with the period during which COVID-19 measures were in place from March 2020 onwards.
GOODS
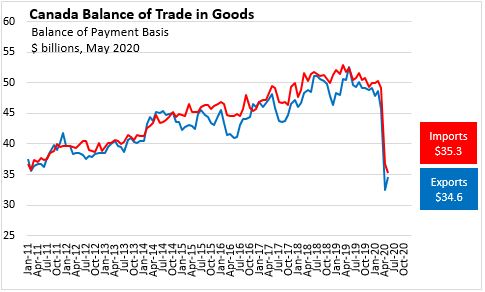
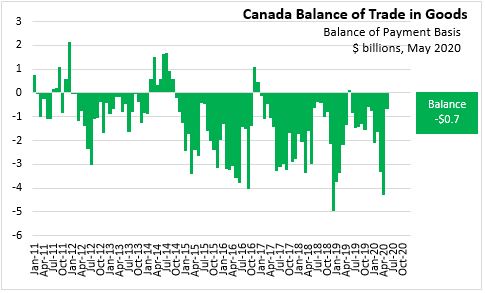
In May 2020, Canadian goods trade (balance of payment basis, seasonally adjusted) had a deficit of $676.7 million, down sharply from a revised deficit in April of $4,266.0 million. Compared with April 2020, exports of goods were up 6.7 per cent to $34.6 billion, while imports of goods were down 3.9 per cent to $35.3 billion.
Since February 2020, Canada's goods imports have declined by 29.8 per cent while exports have fallen 28.8 per cent.
Compared to May 2019, Canada's goods exports were down 34.1 per cent as of May 2020, while imports were down 32.6 per cent. Services exports were down 29.2 per cent while services imports fell 39.0 per cent. Total exports of goods and services are down 33.2 per cent while imports are down 33.9 per cent.
The balance of trade in goods shifted from a surplus of $127.7 million in May 2019 to a deficit of $676.7 million in May 2020. Net trade in services improved from a deficit of $1,604.0 million in May 2019 to a surplus of $115.0 million in May 2020. Canada's overall balance of trade has improved from a deficit of $1,476.3 million in May 2019 to a deficit of $561.7 million in May 2020

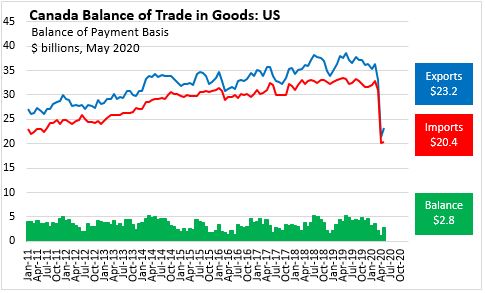
In May 2020, the Canadian merchandise trade (balance of payment basis, seasonally adjusted), surplus with the United States widened to $2,845.8 millions. Since February 2020, Canada's exports to the US are down 36.3 per cent while imports from the US are down 37.8 per cent.
In May 2020, the Canadian merchandise trade (balance of payment basis, seasonally adjusted), deficit with China widened to $1,786.3 millions. Compared to February 2020, Canada's exports to China are up 32.4 per cent while imports to China are up 35.0 per cent.

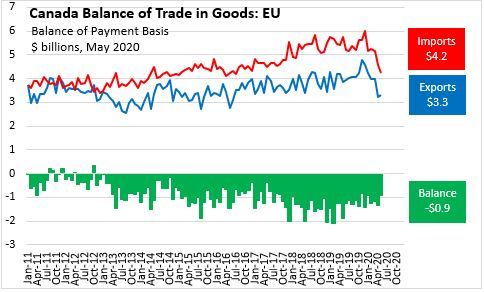
In May 2020, the Canadian merchandise trade (balance of payment basis, seasonally adjusted), deficit with the European Union narrowed to $924.7 millions. Since February 2020, Canada's exports to the EU are down 17.3 per cent while imports from the EU are down 19.4 per cent.
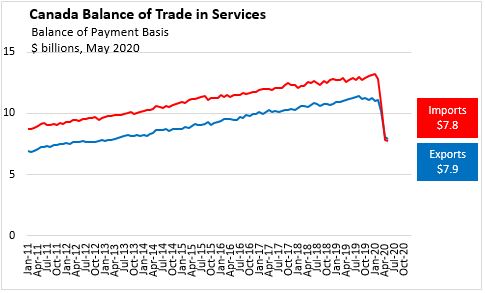
SERVICES
Canada's trade in services are categorized into: commercial services, travel services, transportation services and government services.
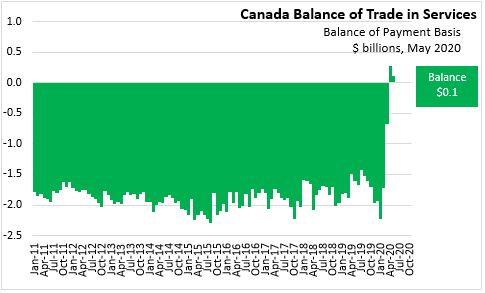
In May 2020, Canada's services trade (balance of payment basis, seasonally adjusted) had a surplus of $115.0 million, down from a surplus of $277.0 million in April. Services imports were down 0.6 per cent to $7.8 billion, while services exports were down 2.6 per cent to $7.9 billion.
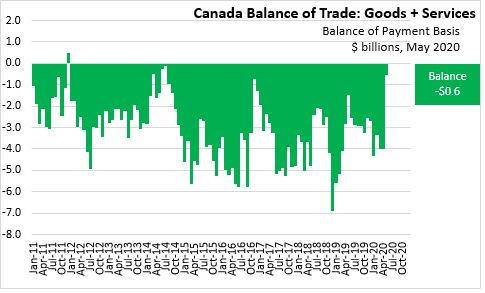
GOODS & SERVICES
The overall balance of trade is calculated by summing the value of goods and services (balance of payment basis, seasonally adjusted).
In May 2020, Canada's overall trade deficit narrowed to $561.7 million, compared to a revised deficit of $3,989.0 million in April. Imports of goods and services were down 3.3 per cent from April, at $43.1 billion. Exports of goods and services were up by 4.8 per cent from April, to $42.5 billion.

Source: Statistics Canada
Table 12-10-0011-01 International merchandise trade for all countries and by Principal Trading Partners, monthly (x 1,000,000)
Table 12-10-0121-01 International merchandise trade by commodity, monthly (x 1,000,000)
Table 12-10-0144-01 International trade in services, monthly (x 1,000,000)
<--- Return to Archive