The Economics and Statistics Division maintains archives of previous publications for accountability purposes, but makes no updates to keep these documents current with the latest data revisions from Statistics Canada. As a result, information in older documents may not be accurate. Please exercise caution when referring to older documents. For the latest information and historical data, please contact the individual listed to the right.
<--- Return to Archive
For additional information relating to this article, please contact:
July 21, 2020NEW HOUSING PRICE INDEX, JUNE 2020 JUNE 2020
Statistics Canada noted that in the third full month of modified operations due to COVID-19, the residential builders surveyed reported increased sales volumes in June compared to the previous month. While sales were up, the residential construction industry experienced some labour and material shortages and were not able to operate at full capacity due to the physical distancing requirements.
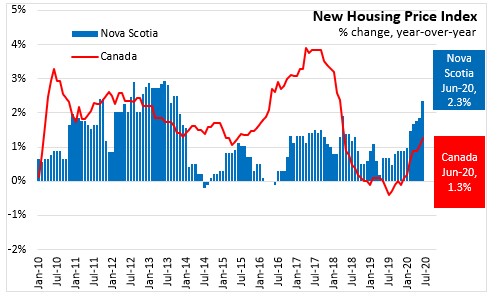
New housing prices in Nova Scotia increased 0.5 per cent month over month in June 2020 – posting the largest monthly increase across all provinces. At the national level, new house prices increased 0.1 per cent for the second consecutive month in June 2020.

Year-over-Year (June 2020 vs June 2019)
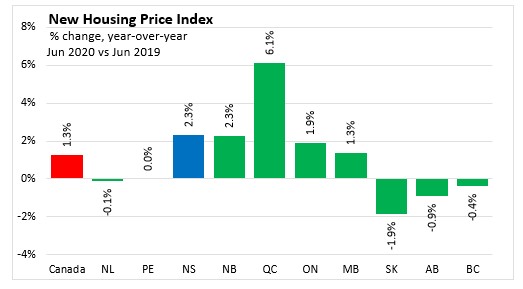
In Nova Scotia, new housing prices were 2.3 per cent higher than they were in June 2019. National new housing prices were up 1.3 per cent. In Canada, new housing prices have been increasing on a year-over-year basis for seven consecutive months.
In June, Quebec saw the fastest year-over-year growth in new housing prices at 6.1 per cent. New housing prices were lower in Saskatchewan (-1.9%), Alberta (-0.9%), British Columbia (-0.4%), and Newfoundland and Labrador (-0.1%).
Census Metropolitan Areas
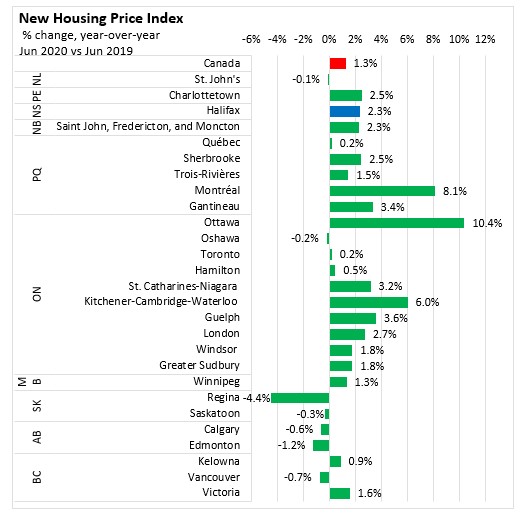
Comparing June 2020 to June 2019, price growth among Census Metropolitan Areas was fastest in Ottawa, Montreal, and Kitchener-Cambridge-Waterloo. New housing prices declined the most in Regina, Edmonton, Calgary, Saskatoon, and Vancouver. New housing prices were down in all CMAs in Saskatchewan and Alberta. New housing price index also declined in Vancouver (-0.7%), Oshawa (-0.2%), and St. John’s (-0.1%).
During the COVID-19 pandemic, comparisons of year-to-date averages and sums do not show Nova Scotia’s rapidly-changing economic situation. The DailyStats will focus on year-over-year comparisons, comparing one month with the same month in the prior year. Where possible the DailyStats will make comparisons of seasonally adjusted data from the pre-COVID-19 period (January and February 2020) with the period during which COVID-19 measures were in place from March 2020 onwards.
Statistics Canada Note: With the release of the January 2017 NHPI data, a number of important changes have been introduced to increase the relevance of the index series. The index base period, for which the NHPI equals 100, is now December 2016. The NHPI basket has been updated with new weights for the 2017 series, its coverage has been expanded to include new CMAs.
Source Statistics Canada. Table 18-10-0205-01 New housing price index, monthly
<--- Return to Archive