The Economics and Statistics Division maintains archives of previous publications for accountability purposes, but makes no updates to keep these documents current with the latest data revisions from Statistics Canada. As a result, information in older documents may not be accurate. Please exercise caution when referring to older documents. For the latest information and historical data, please contact the individual listed to the right.
<--- Return to Archive
For additional information relating to this article, please contact:
August 05, 2020NOVA SCOTIA - INTERNATIONAL MERCHANDISE TRADE JUNE 2020 Year-over-year (Jun 2020 vs Jun 2019, customs based, unadjusted)
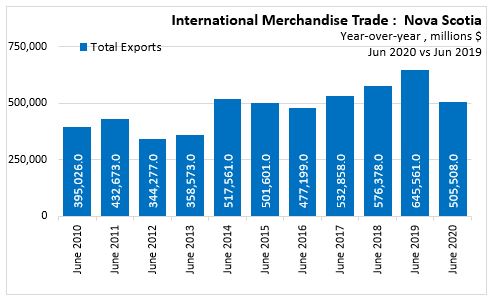
In June 2020, Nova Scotia International Merchandise Trade Exports decreased 21.7% (-$140.1 million) over June 2019, to $505.5 million.
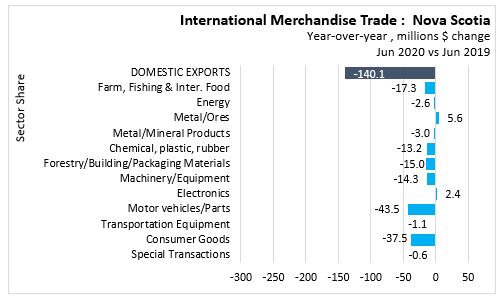
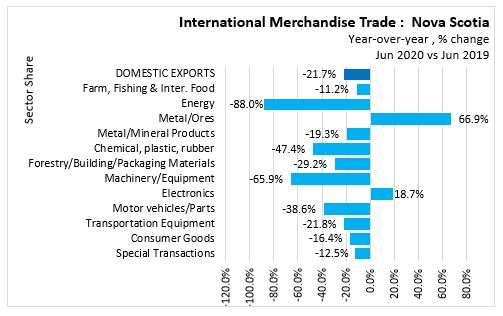
Year-over-year - By Sector
Comparing Nova Scotia's exports for June 2020 with the same period last year, all sectors were in decline, except Metal/Ores, and electronics Two sectors reported positive dollar value growth: Metal/Ores (+$5.6 million) and Electronics (+$2.4 million).on). The largest dollar value declines were in Motor vehicles/Parts (-$43.5 million), Consumer Goods (-$37.5 million), and Farm, Fishing and Inter. Food (-$17.3 million).
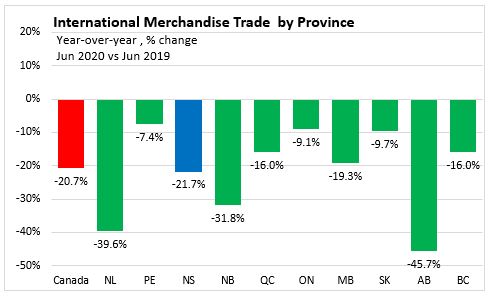
Year-over-year by Province
In June 2020 Prince Edward Island reported the lowest decline (-7.4%), while Alberta reported the highest decline (-45.7%) in merchandise trade exports over June 2019. Nova Scotia reported a 21.7% decline in merchandise trade exports. Canada reported a 20.7% decline in merchandise trade exports, over June 2019.
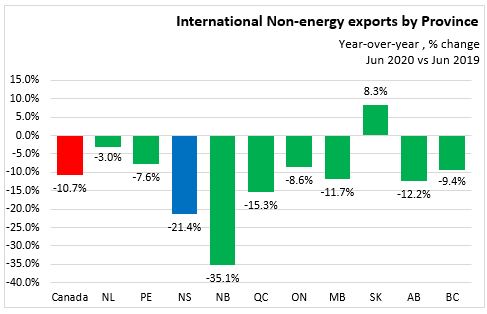
Excluding energy exports, Saskatchewan reported the only increase (+8.3%) while New Brunswick reported the highest decline (-35.1%) in Non-energy exports over June 2019. Nova Scotia reported a 21.4% decline in Non-energy exports. Canada reported a 10.7% decline in Non-energy exports over June 2019.
YEAR-OVER-YEAR EXPORTS BY INTERNATIONAL DESTINATION
By Commodity
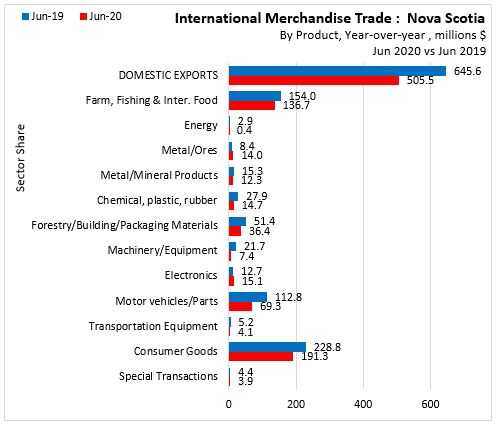
In Nova Scotia June 2020, international export trade to all countries decreased -21.7% to $505.5 million over June 2019.
- Consumer Goods led the way with a value of $191.3 million (37.8% share), followed by
- Farm, Fishing & Inter. Food with a value of $136.7 million (27.0% share),
- Motor vehicles/Parts with a value of $69.3 million (13.7% share),
- Forestry/Building/Packaging Materials with a value of $36.4 million (7.2% share),
- Electronics with a value of $15.1 million (3.0% share),
- Chemical, plastic, rubber with a value of $14.7 million (2.9% share),
- Metal/Ores with a value of $14.0 million (2.8% share),
- Metal/Mineral Products with a value of $12.3 million (2.4% share),
- Machinery/Equipment with a value of $7.4 million (1.5% share),
- Transportation Equipment with a value of $4.1 million (0.8% share),
- Special Transactions with a value of $3.9 million (0.8% share), and ,
- Energy with a value of $0.4 million (0.1% share).
By Trading Partner
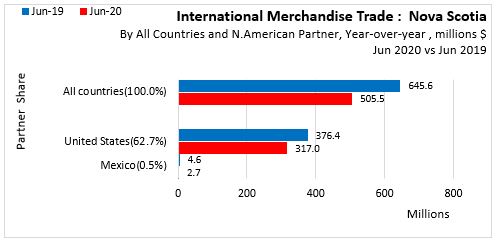
In North America, June 2020 vs June 2019, year-over-year export trade to United States decreased 15.8% (-$59.4 million) to $317.0 million. Mexico decreased 42.5% (-$2.0 million) to $2.7 million.
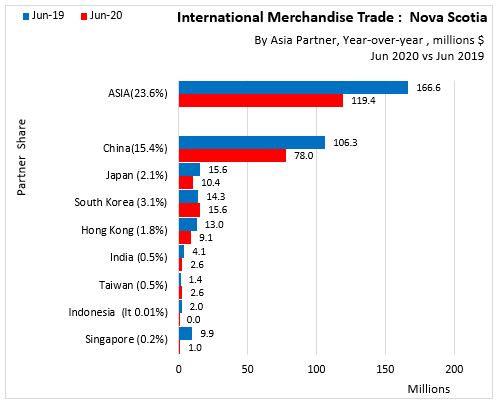
In Asia, June 2020 vs June 2019, year-over-year export trade to China decreased 26.7% (-$28.3 million) to $78.0 million; Japan down 33.2% (-$5.2 million) to $10.4 million; South Korea up 9.4% ($1.3 million) to $15.6 million; Hong Kong down 30.0% (-$3.9 million) to $9.1 million; India down 37.0% (-$1.5 million) to $2.6 million; Taiwan up 90.7% ($1.2 million) to $2.6 million; Indonesia down 98.7% (-$2.0 million) to $0.03 million; Singapore down 89.5% (-$8.9 million) to $1.0 million.
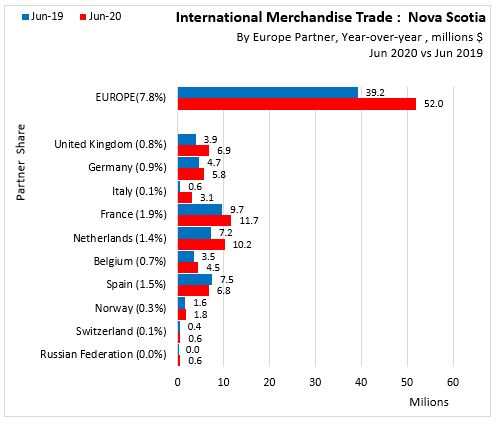
In Europe, June 2020 vs June 2019, year-over-year export trade to United Kingdom down 42.8% (-$2.9 million) to $3.9 million; Germany down 18.9% (-$1.1 million) to $4.7 million; Italy down 81.8% ($2.6 million) to $0.6 million; France down 17.1% (-$2.0 million) to $9.7 million; Netherlands down 29.1% (-$3.0 million) to $7.2 million; Belgium down 23.2% (-$1.0 million) to $3.5 million; Spain up 10.5% (+$0.1 million) to $7.5 million; Norway down 6.3% (-$0.1 million) to $1.6 million; Switzerland down 26.3% (-$0.2 million) to $0.4 million; Russian Federation down 93.0% (-$0.5 million) to $0.04 million.
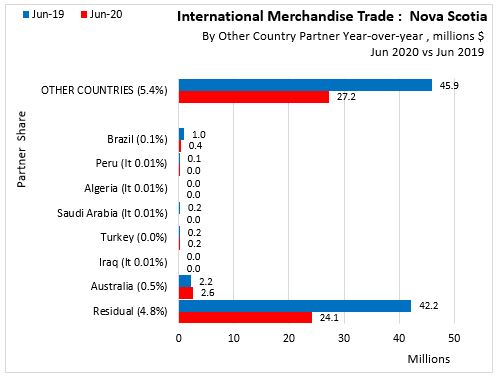
In other countries, June 2020 vs June 2019, year-over-year export trade to Brazil down 63.1% (-$0.6 million) to $0.4 million; Peru down 89.6% (-$0.121 million) to $0.014 million; Algeria no trade; Saudi Arabia no trade; Turkey up $0.001 million to $0.2 million; Iraq no trade; Australia up 14.4% ($0.322 million) to $2.6 million; Residual down 42.8% (-$18.1 million) to $24.1 million.
12-10-0119-01 International merchandise trade: Nova Scotia sectors
12-10-0119-01 International merchandise trade: by province and commodity
12-10-0119-01 International merchandise trade: by province and energy commodity
12-10-0119-01 International merchandise trade: by province, commodity, trading partners
Trading partners group 1: All, US, China
Trading partners group 2: Japan et al
Trading partners group 3: UK et al
Trading partners group 4: Mexico et al
<--- Return to Archive