The Economics and Statistics Division maintains archives of previous publications for accountability purposes, but makes no updates to keep these documents current with the latest data revisions from Statistics Canada. As a result, information in older documents may not be accurate. Please exercise caution when referring to older documents. For the latest information and historical data, please contact the individual listed to the right.
<--- Return to Archive
For additional information relating to this article, please contact:
August 06, 2020CANADIAN COMMUNITY HEALTH SURVEY, 2019 Statistics Canada has released results from the 2019 Canadian Community Health Survey.
This survey is an annual population health survey that provides insight into life satisfaction, stress, perceived health, health conditions and behaviours of the Canadian population. Note: the CCHS was conducted neither in the Territories nor on reserves.
Life satisfaction, belonging to community and life stress
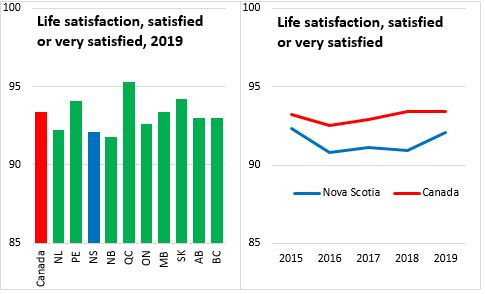
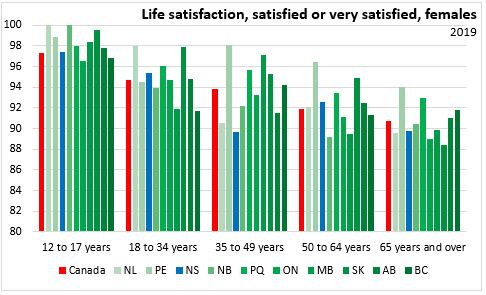
Over 90 per cent of all Canadians report being satisfied or very satisfied with their life at the moment, reporting a score of 6 or greater on a scale of 1 to 10. The highest percentage of the population reporting being satisfied or very satisfied was in Quebec while the lowest was in New Brunswick. The share of Nova Scotia's population who were satisfied or very satisfied with their life at the moment was 92.1 per cent, an increase from 90.9 per cent in 2018.
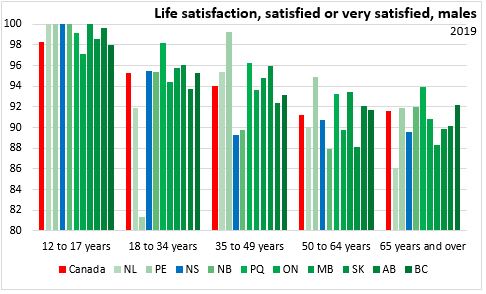
Life satisfaction by income group in Nova Scotia is lowest for those in the lowest quintiles of earnings. By education, those with less than a high school education (<HS) report the lowest percentage who are satisfied or very satisfied with their life at the moment. Life satisfaction is higher for those in higher income quintiles and among those with post secondary education (PSE). By age and sex cohorts, younger Nova Scotians (aged 12-17) report the highest share who are satisfied or very satisfied at almost 99 per cent. Those aged 35-49 and 65+ report less satisfaction with their life. Females report slightly higher life satisfaction than males in Nova Scotia.
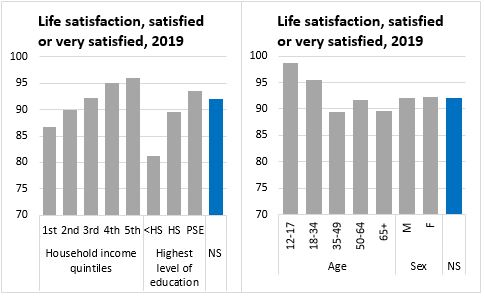
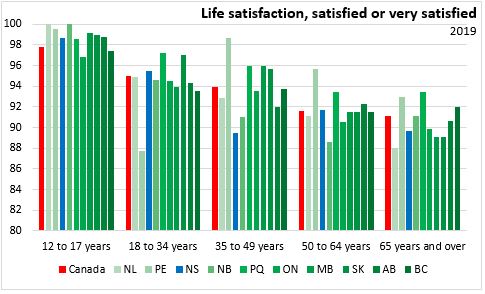
Compared with age and sex cohorts across Canada, younger Nova Scotians (ages 12-17 and 18-34) report greater life satisfaction than the national average. Nova Scotians aged 35-49 and 65+ report lower life satisfaction than the national average for these ages.
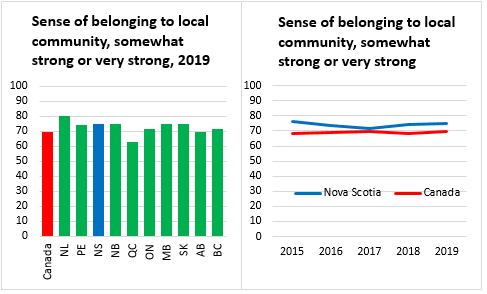
Three quarters (75 per cent) of Nova Scotians report feeling a sense of belonging to their local community, higher than the national average. The sense of belonging to community is strongest in Newfoundland and Labrador and lowest in Quebec. Nova Scotia's sense of belonging to community has been rising in each of the last two years.
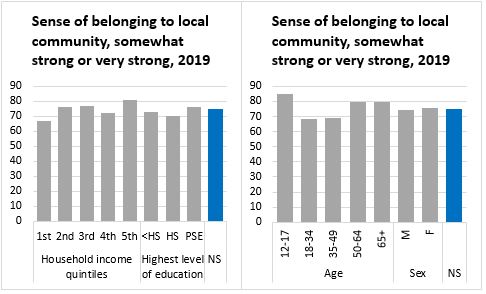
Belonging to community does not follow consistent patterns by income or education level in Nova Scotia. There is a higher sense of belonging to community among younger Nova Scotians (12-17) and those over 50 years old.
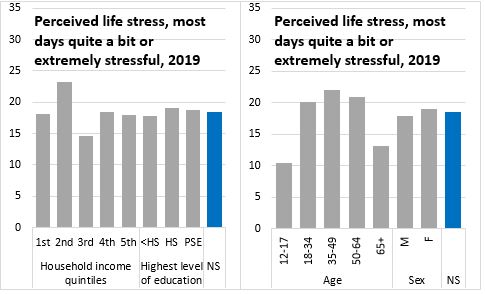
Nova Scotians (18.5 per cent) generally report lower levels of life stress than the national average (21.2 per cent). Life stress is highest in Quebec and lowest in Newfoundland and Labrador.
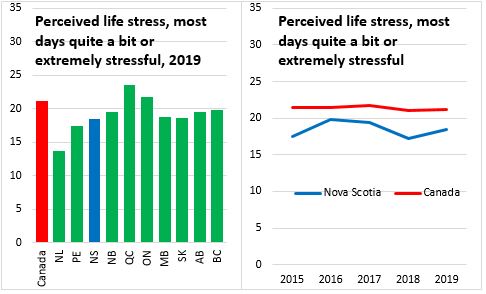
Life stress was notably higher among those in the second income quintile and lowest among those in the third income quintile in Nova Scotia. Life stress was lower for younger Nova Scotians (ages 12-17) and those over 65. Females reported higher life stress than males.
Life stress can manifest through a number of channels. In the 2019 CCHS, respondents were asked about the causes of life stress and whether they felt able to handle daily demands and occasional problems.
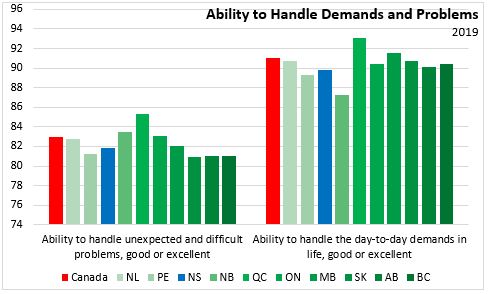
A lower than average share of Nova Scotians reported a good or excellent ability to handle day-to-day life stresses. Those living in Quebec reported the strongest ability to handle day-to-day stresses while those in New Brunswick reported the least ability.
Fewer Nova Scotians than the national average reported a good or excellent ability to handle unexpected or difficult problems. The highest ability to handle these problems was reported in Quebec and the lowest in Saskatchewan.
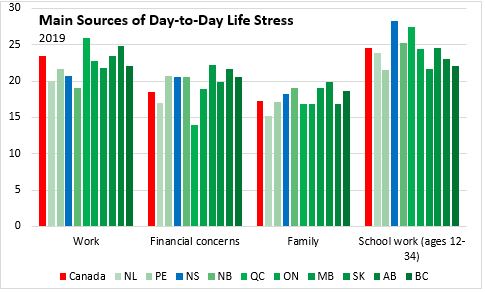
Across Canada work, school, family and financial concerns are the most frequently cited cause of day-to-day life stress. More Nova Scotians (aged 12-34) reported school as the main source of life stress than in any other province.

Perceptions of physical and mental health
The CCHS asks Canadians how they perceive their physical and mental health.
Nova Scotians (aged 12+) had the second lowest share of the population who reported very good or excellent physical health. New Brunswick had the lowest share reporting excellent or very good physical health while those in Newfoundland and Labrador reported the highest share. Nova Scotia's share of very good or excellent health has been declining for the last two years.
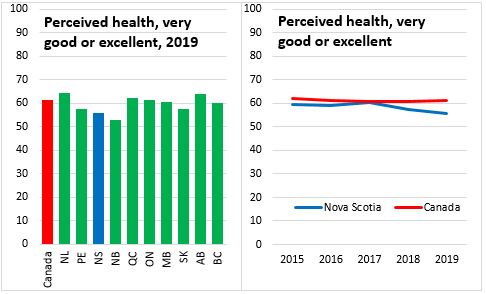
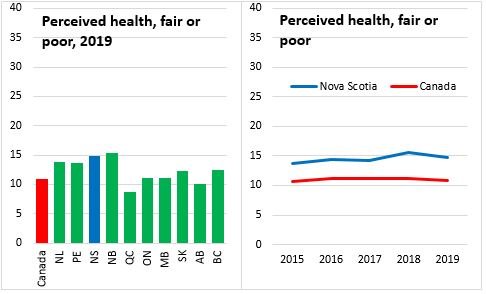
Nova Scotia had the second highest share of the population that reported perceived physical health to be fair or poor (after New Brunswick). Perceived fair or poor physical health was lowest in Quebec.
Perceptions of very good or excellent physical health rise with income and education levels. Perceived physical health declines with age. The relatively older populations in the Maritimes contribute to lower perceptions of physical health. Males generally have stronger perceptions of their physical health than females.

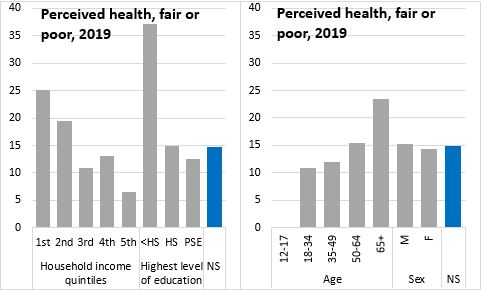
Perceived fair and poor physical health is notably higher among those in the first and second income quintiles as well as among those with less than a high school education.
Nova Scotia has the second lowest perception of very good or excellent mental health. The share of Nova Scotians (and Canadians) who perceive that they have very good or excellent mental health has been declining. Across Canada perceived mental health is highest in Quebec and lowest in Prince Edward Island.

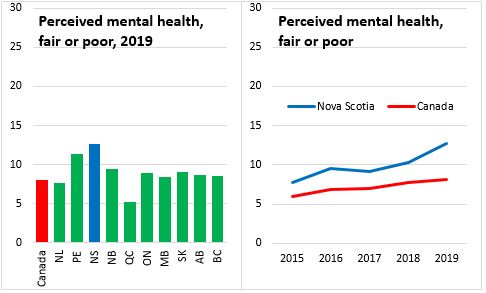
Nova Scotia has the highest portion of the population that reports fair or poor mental health. This portion has been rising in Nova Scotia and in Canada. Quebec has the smallest portion of the population that reports fair or poor mental health.
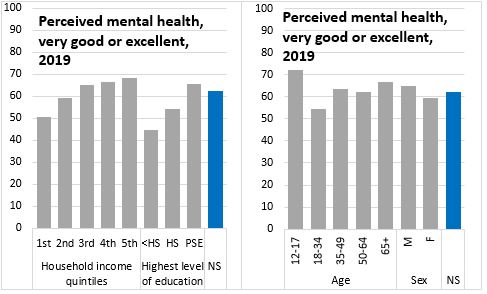
Perceptions of mental health are stronger for those in higher income quintiles and those with more education. Younger Nova Scotians (aged 12-17) report stronger perceived mental health while those aged 18-34 were less likely to report very good or excellent mental health. Males in Nova Scotia reported stronger perceptions of mental health than females in Nova Scotia.
Fair or poor mental health was more commonly reported in the lowest income quintile, among those with less than a high school education and among those aged 18-34.

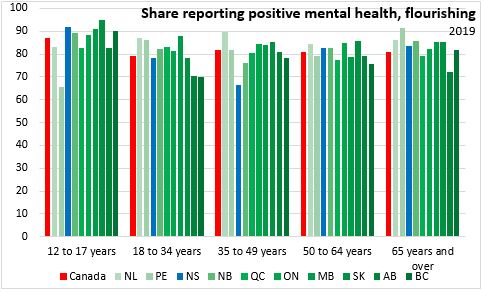
As an alternative to perceived mental health, Statistics Canada also measured the share of the population that reports flourishing mental health. This means those who report high levels of emotional well-being and positive functioning on almost every day of the month.
By this measure a higher portion of Nova Scotians aged 12 to 17 and older than 50 report flourishing mental health than the national average. Nova Scotians aged 35 to 49 report the lowest percentage with flourishing mental health.
Health conditions
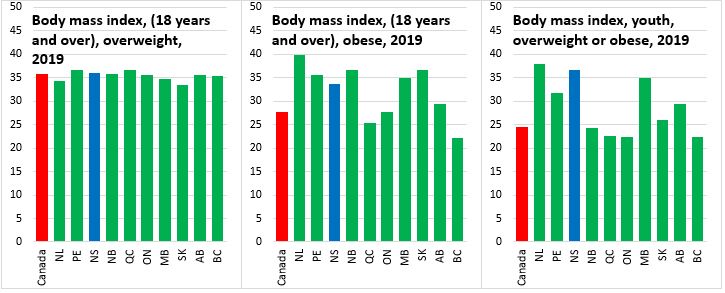
The portion of Nova Scotia's adult population that reports being overweight (using an adjusted self-assessment) is similar to the national average. However, the portion of Nova Scotian adults who report obesity is higher than the national average. The share of Nova Scotia's youth (ages 12-17) who are overweight or obese is also higher than the national average.
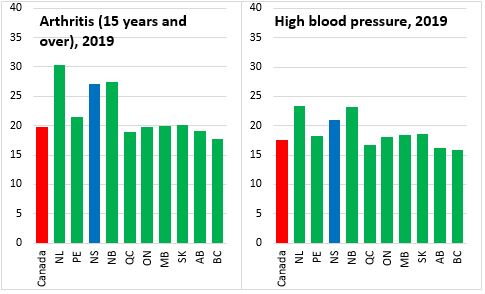
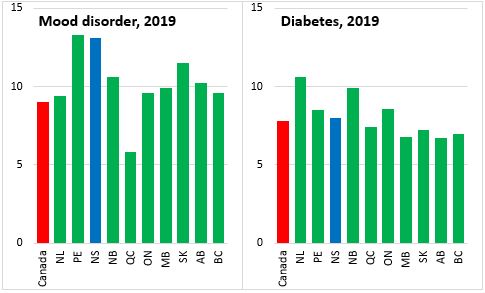
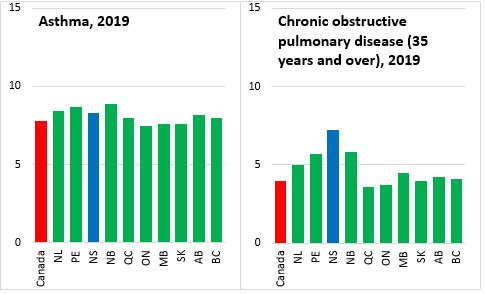
Among common chronic health conditions, Nova Scotia has higher than average prevalence of arthritis, high blood pressure, mood disorders (second highest prevalence among provinces), diabetes, asthma and chronic obstructive pulmonary disease (highest prevalence among provinces).
Nova Scotia reports the second highest portion of daily smokers among provinces, though this declined in the last year. The highest prevalence of daily smoking was in Newfoundland and Labrador and the lowest in British Columbia.

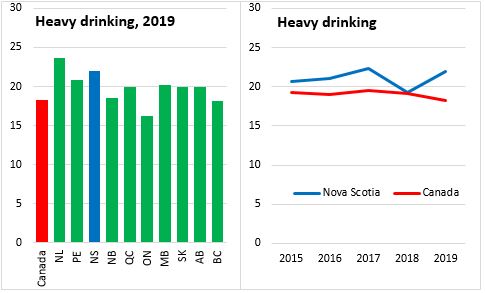
Nova Scotia also reports the second highest prevalence of heavy drinking (4-5 drinks on a least one occasion once a month in the last year). The prevalence of heavy drinking in Nova Scotia increased in 2019. The highest prevalence of heavy drinking was in Newfoundland and Labrador and the lowest in Ontario.
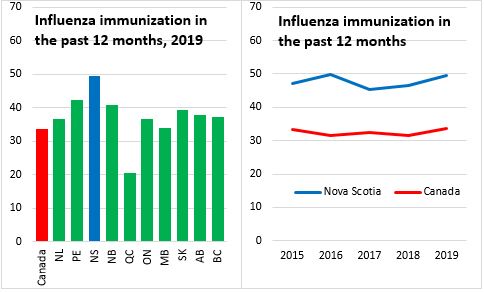
Nova Scotians consistently report the highest use of flu vaccines. The lowest use of flu vaccines was in Quebec.
Source: Statistics Canada. Table 13-10-0096-01 Health characteristics, annual estimates; Table 13-10-0097-01 Health characteristics, annual estimates, by household income quintile and highest level of education; Table 13-10-0098-01 Mental health characteristics and suicidal thoughts
<--- Return to Archive