The Economics and Statistics Division maintains archives of previous publications for accountability purposes, but makes no updates to keep these documents current with the latest data revisions from Statistics Canada. As a result, information in older documents may not be accurate. Please exercise caution when referring to older documents. For the latest information and historical data, please contact the individual listed to the right.
<--- Return to Archive
For additional information relating to this article, please contact:
September 11, 2020CANADA NATIONAL BALANCE SHEET ACCOUNTS, Q2 2020 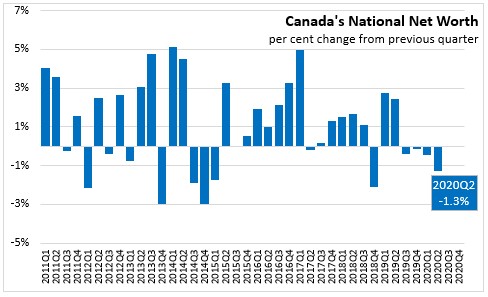
In the second quarter of 2020, Canadian national wealth declined 1.3 per cent (or -$146.9 billion) to $11,554.5 billion. This follows a revised decrease of 0.5 per cent in the first quarter of 2020. As with the previous quarter, the negative growth was largely attributable to a decrease in the value of natural resource assets, it is the fourth consecutive quarterly decline. Residential real estate asset values increased by 1.4 per cent, as the price of property remained healthy despite limited investment. Net foreign assets increased as global stock markets recovered at the end of Q2 2020.

Total assets, including financial and non-financial assets increased by 5.0 per cent to $47,061 billion at the end of Q2 2020.
Household sector
In Q2 2020, Canada’s household sector net worth increased 5.0% to $11,956.2 billion, a record rebound following the record decline in Q1 2020. Financial assets increased $501.0 billion, as its main contributors were equity and investment funds. The Toronto Stock Exchange increased 16.0 per cent following a 21.6 per cent drop in Q1 2020. Financial liabilities edged up 0.4 per cent.
Currency and deposit assets increased $93.9 billion in Q2 2020, an unprecedented single quarter increase, as households reacted to the effects of the COVID-19. The household savings rate increased from 7.6 per cent to 28.2 per cent in Q2 2020, mainly because of a record decrease in household spending (-13.7 per cent).
The value of non-financial assets grew $74.5 billion in Q2 2020, largely attributable to an increase of $78.4 billion in residential real estate. Residential resale sales volumes, reflecting activity in the resale housing market, were 47.7 per cent lower in April and May 2020 than the same period in 2019 due to COVID-19 related restrictions. Meanwhile, June 2020 saw a year-over-year increase of 16.1 per cent in sales volumes compared to June 2019.
Household borrowing declined to $0.9 billion in Q2 2020 from $26.0 billion in Q1 2020. Consumer credit and non-mortgage lending declined to $21.5 billion in total while mortgage lending increased to $22.3 billion.
Household credit market debt as a proportion of household disposable income decreased to 158.21 per cent in Q2 2020.

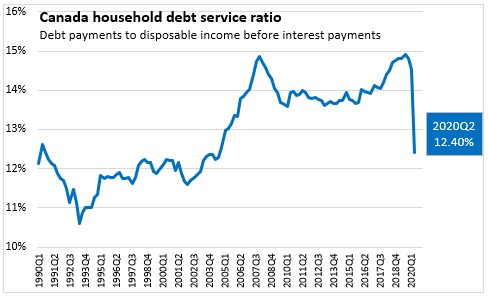
In Q2 2020, household debt payments declined from 14.54 per cent to 12.40 per cent of disposable income (before interest payments), the largest decline on the record. Payment deferrals related to the COVID-19 reduced the obligated principal in Q2 2020.
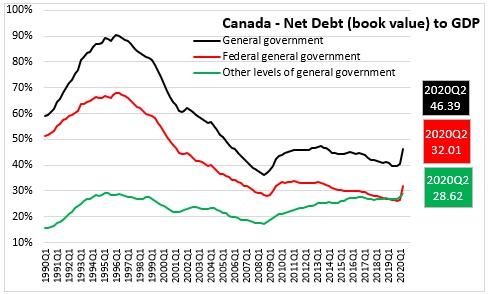
Government sector
At the end of Q2 2020, general government net debt (book value) increased to 46.39 per cent of GDP. The federal government's net debt to GDP ratio increased to 32.01 per cent, as federal government net debt increased, and GDP was impacted by COVID-19-related shutdowns. Net debt of other levels of government is increased to 28.62 per cent of GDP.
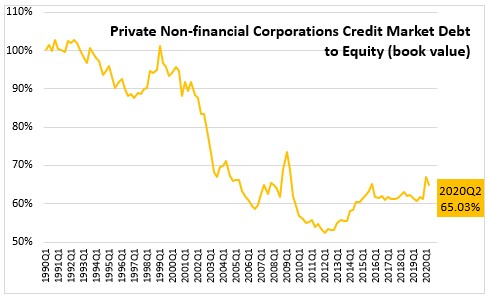
Corporate sector
The credit market debt to equity ratio of non-financial private corporations decreased to 65.03 cents of credit market debt for every dollar of equity in the Q2 2020, down from 67.04 cents (revised) in Q1 2020.
Statistics Canada: Daily
Table 11-10-0065-01 Debt service indicators of households, national balance sheet accounts
Table 36-10-0580-01 National Balance Sheet Accounts (x 1,000,000)
Table 38-10-0235-01 Financial indicators of households and non-profit institutions serving households, national balance sheet accounts
Table 38-10-0236-01 Financial indicators of corporate sector, national balance sheet accounts
Table 38-10-0237-01 Financial indicators of general government sector, national balance sheet accounts
Table 38-10-0238-01 Household sector credit market summary table, seasonally adjusted estimates
<--- Return to Archive