The Economics and Statistics Division maintains archives of previous publications for accountability purposes, but makes no updates to keep these documents current with the latest data revisions from Statistics Canada. As a result, information in older documents may not be accurate. Please exercise caution when referring to older documents. For the latest information and historical data, please contact the individual listed to the right.
<--- Return to Archive
For additional information relating to this article, please contact:
September 21, 2020NEW HOUSING PRICE INDEX, AUGUST 2020 AUGUST 2020
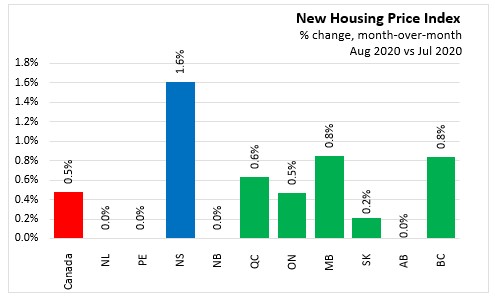
New housing prices in Nova Scotia increased 1.6 per cent month over month in August 2020, posting the largest monthly gain across all provinces.
Nationally, new home prices increased 0.5 per cent month-over-month. This was the fourth consecutive monthly gain at the national level and the largest monthly increase for new home prices at the national level since May 2017.
Statistics Canada noted that home prices were up due to increased demand for single-family homes and higher building material costs. Looking ahead, the shortage of lumber and building supplies due to increased homebuyer demand and renovation activities is expected to continue to put upward pressure on new house prices.
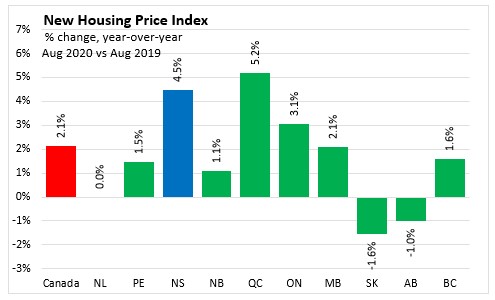
Year-over-Year (August 2020 vs August 2019)
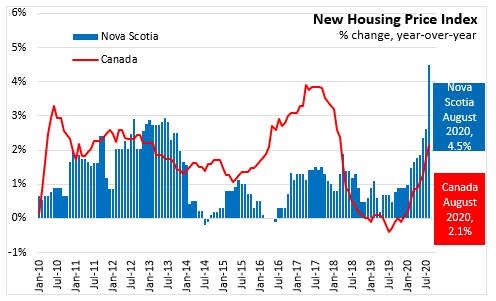
In Nova Scotia, new housing prices were 4.5 per cent higher than they were in August 2019. This was the fastest year-over-year growth in Nova Scotia since November 2008 and the second largest annual growth across all provinces, just behind Quebec (+5.2%). New housing prices were lower in Saskatchewan (-1.6%), and Alberta (-1.0%) while prices remained flat in Newfoundland and Labrador.
In Canada, new house prices increased 2.1 per cent year-over-year in August recording the largest annual growth since May 2018.
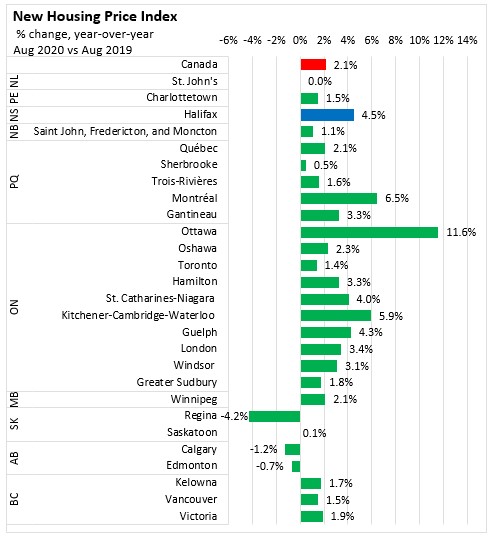
Census Metropolitan Areas
In August, new home prices increased year-over-year in the majority of the Census Metropolitan Areas. The fastest growth was recorded in Ottawa (+11.6%) and Montreal (+6.5%). Prices in Halifax were 4.5 per cent higher compared to August 2019.
New house prices declined in Regina (-4.2%), Calgary (-1.2%) and Edmonton (-0.7%).
During the COVID-19 pandemic, comparisons of year-to-date averages and sums do not show Nova Scotia’s rapidly-changing economic situation. The DailyStats will focus on year-over-year comparisons, comparing one month with the same month in the prior year. Where possible the DailyStats will make comparisons of seasonally adjusted data from the pre-COVID-19 period (January and February 2020) with the period during which COVID-19 measures were in place from March 2020 onwards.
Statistics Canada Note: With the release of the January 2017 NHPI data, a number of important changes have been introduced to increase the relevance of the index series. The index base period, for which the NHPI equals 100, is now December 2016. The NHPI basket has been updated with new weights for the 2017 series, its coverage has been expanded to include new CMAs.
Source Statistics Canada. Table 18-10-0205-01 New housing price index, monthly
<--- Return to Archive