The Economics and Statistics Division maintains archives of previous publications for accountability purposes, but makes no updates to keep these documents current with the latest data revisions from Statistics Canada. As a result, information in older documents may not be accurate. Please exercise caution when referring to older documents. For the latest information and historical data, please contact the individual listed to the right.
<--- Return to Archive
For additional information relating to this article, please contact:
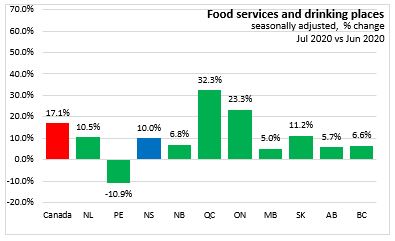
September 23, 2020FOOD SERVICES AND DRINKING PLACES, JULY 2020 Month over month (Jul-20 vs Jun-20, seasonally adjusted)
In Nova Scotia food services and drinking places receipts increased 10.0 per cent to $106.5 million.
Canada's food services and drinking places receipts increased 17.1 per cent to $4.6 billion.
Nine provinces reported monthly increases in food services and drinking places, with Quebec (32.3%) reporting the largest gain, and Prince Edward Island (-10.9%) reporting the only decline in percentage terms.
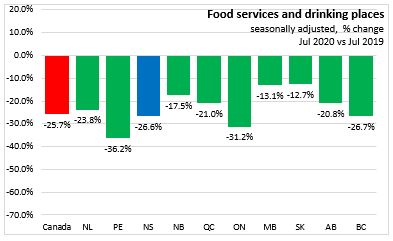
Year-over-Year (Jul-20 vs Jul-19, seasonally adjusted)
In Nova Scotia food services and drinking places receipts decreased 26.6 per cent.
Canada's food services and drinking places receipts decreased 25.7 per cent.
All of the provinces reported year-over-year declines in food services and drinking place receipts, with Saskatchewan (-12.7%) reporting the smallest decline and Prince Edward Island (-36.2%) reporting the largest decline in percentage terms.
Pandemic Period (July 2020 vs February 2020, seasonally adjusted)
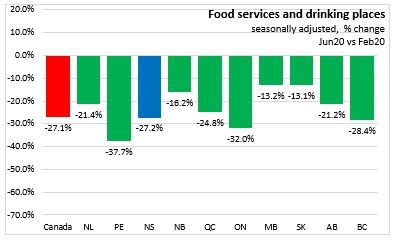
In Nova Scotia food services and drinking places receipts decreased 27.2 per cent between February 2020 and July 2020. Canada's food services and drinking places receipts decreased 27.1 per cent over the sale period.
All provinces reported pandemic period declines in food services and drinking place receipts, with Prince Edward Island (-37.7%) reporting the largest decline and Saskatchewan (-13.1%) reporting the smallest decline in percentage terms.
Long-run Trend
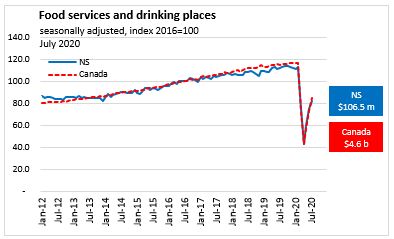
Prior to the start of COVID-related measures, Nova Scotia's food services and drinking place receipts were slowing. After COVID-related closures and restrictions were imposed, food services and drinking places receipts declined dramatically. In the last three months, all provinces have reported increases in monthly receipts, but as of July 2020 all are still well below pre-COVID levels.
Nova Scotia Year-over-year Sales by Establishment Type (Jul-20 vs Jun-19, unadjusted for seasonality)
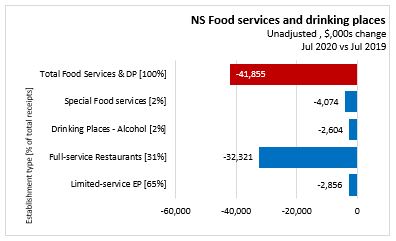
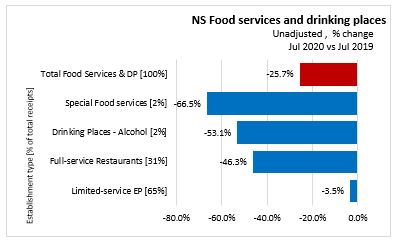
Compared with the same month last year, the reductions in food service and drinking place receipts have been most pronounced for Nova Scotia's full service restaurants. In percentage terms, the declines have been more severe for Special food services.
- Limited-service eating places, decreased 3.5 per cent (-$2.9 million) to $79.2 million.
- Full-service restaurants decreased 46.3 per cent (-$32.3 million) to $37.6 million.
- Special food services decreased 66.5 per cent (-$4.1 million) to $2.1 million.
- Drinking places -alcoholic beverages decreased 53.1 per cent (-$2.6 million) to $2.3 million.
During the COVID-19 pandemic, comparisons of year-to-date averages and sums do not show Nova Scotia’s rapidly-changing economic situation. The DailyStats will focus on year-over-year comparisons, comparing one month with the same month in the prior year. Where possible the DailyStats will make comparisons of seasonally adjusted data from the pre-COVID-19 period (January and February 2020) with the period during which COVID-19 measures were in place from March 2020 onwards.
Source: Statistics Canada. Table 21-10-0019-01 Monthly survey of food services and drinking places (x 1,000)
<--- Return to Archive