The Economics and Statistics Division maintains archives of previous publications for accountability purposes, but makes no updates to keep these documents current with the latest data revisions from Statistics Canada. As a result, information in older documents may not be accurate. Please exercise caution when referring to older documents. For the latest information and historical data, please contact the individual listed to the right.
<--- Return to Archive
For additional information relating to this article, please contact:
September 29, 2020CANADA INDUSTRIAL PRODUCTS AND RAW MATERIALS PRICES, AUGUST 2020 During the COVID-19 pandemic, commodity and industrial product prices will provide indications of large changes in demand and/or supply. The data presented in this article are price indices for Canadian Raw Materials and Canadian Industrial Products.
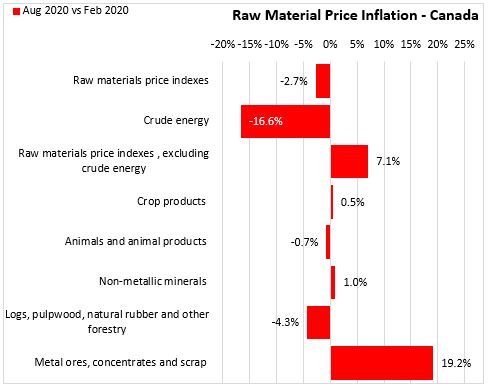
RAW MATERIALS
From February 2020 to August 2020, there were price declines in crude energy (-16.6%), and Logs, pulpwood, natural rubber and other forestry (-4.3%). Metal ores and concentrates were up 19.2%. The overall raw material index down 2.7%.
Most raw material and industrial product category prices were in balance, with only small changes from February to August.
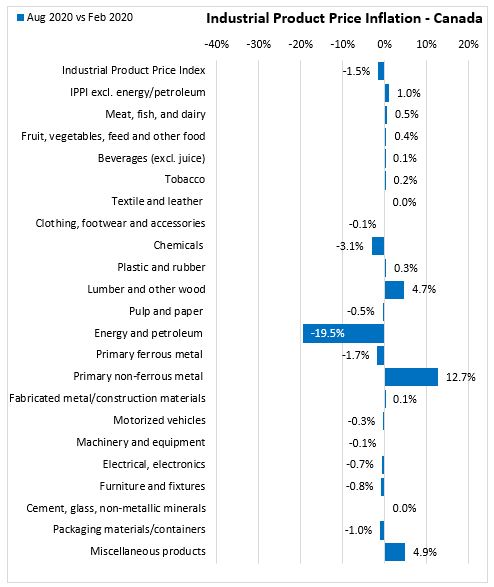
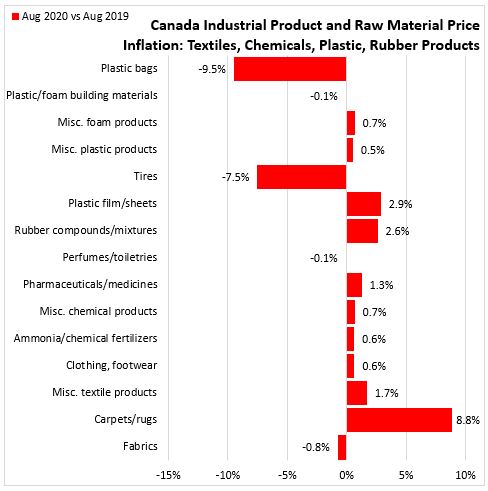
INDUSTRIAL PRICES
Declines occurred in Industrial prices for Energy and petroleum (-19.5%), Chemicals (-3.1%), Primary ferous metals (-1.7%), Packaging materials (-1.0%), Furniture (-0.8%), Electrical (-0.7%), Pulp and paper (-0.5%), Motorized vehicles (-0.3%), and -0.1% in Clothing and Machinery. There was no growth in Cement and Textiles and leather. Gains in Primary non-ferrous metals (12.7%), miscellaneouys products (4.9%), lumber (4.7%), Meat fish and dairy (0.5%), Fruits and vegetables (0.4%), Plastic/Rubber (0.3%), Tobacco (0.2%) and, at 0.1% Fabricated metal and Beverages. The overall decline in the industrial product price index was 1.5% over the February - August period.
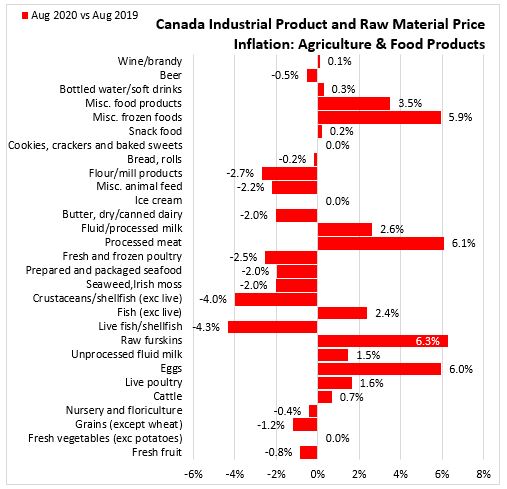
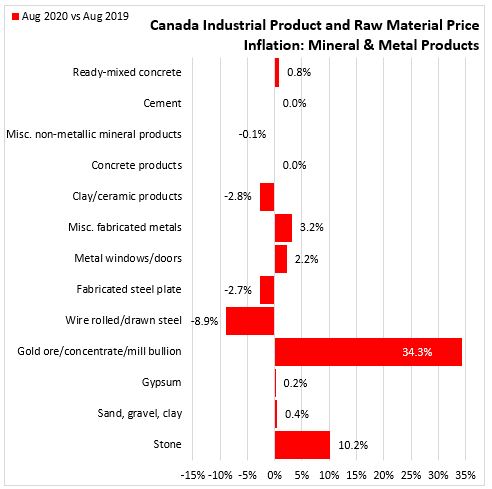
Comparison of price changes for detailed commodities often shows little variation from one month to the next. The following results show year-over-year (Jun-20 vs Jun-19). Canadian raw material and industrial product price changes for selected goods that are produced in Nova Scotia and well as for energy products.
 <
<

Source: Statistics Canada: Table 18-10-0030-01 Industrial product price index, by product, monthly; Table 18-10-0034-01 Raw materials price index, monthly
<--- Return to Archive