The Economics and Statistics Division maintains archives of previous publications for accountability purposes, but makes no updates to keep these documents current with the latest data revisions from Statistics Canada. As a result, information in older documents may not be accurate. Please exercise caution when referring to older documents. For the latest information and historical data, please contact the individual listed to the right.
<--- Return to Archive
For additional information relating to this article, please contact:
October 09, 2020UK TRADE BALANCE, AUGUST 2020
UK TRADE BALANCE
Month-over-month (Aug 2020 vs Jul 2020, seasonally adjusted )
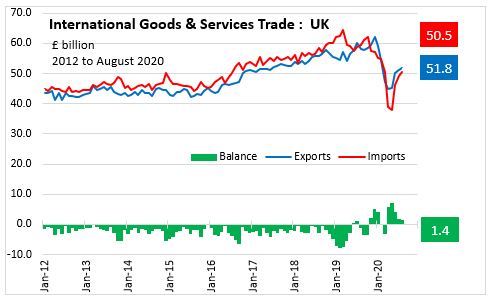
The United Kingdom Goods and services balance of trade surplus narrowed by £0.3 billion to £1.4 billion.
- exports of goods and services increased 1.5% (£0.8 billion) to £51.8 billion
- imports of goods and services increased 2.2% (£1.1 billion) to £50.5 billion
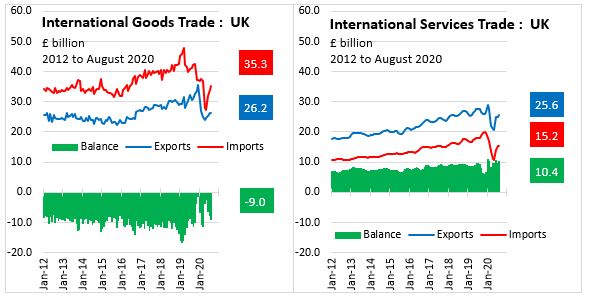
The United Kingdom Goods balance of trade deficit widened by £1.1 billion to £9.0 billion.
- exports of goods increased 0.4% (£0.1 billion) to £26.2 billion
- imports of goods increased 3.7% (£1.3 billion) to £35.3 billion
The United Kingdom Services balance of trade surplus widened by £0.8 billion to £10.4 billion.
- exports of services increased 2.7% (£0.7 billion) to £25.6 billion
- imports of services decreased 1.0% (£0.1 billion) to £15.2 billion
Year-over-year (Aug 2020 vs Aug 2019, seasonally adjusted )
The United Kingdom Goods and services balance of trade surplus changed from a deficit (£1.2 billion) to a surplus (£1.4 billion).
- Goods balance of trade deficit narrowed by £1.5 billion and
- Services balance of trade surplus widened by £1.1 billion
TRADING PARTNERS

Month-over-month (Aug 2020 vs Jul 2020, seasonally adjusted )
The United Kingdom EU-UK Goods balance of trade deficit widened by £0.2 billion to £6.7 billion
- exports of goods decreased 1.6% (£0.2 billion) to £11.4 billion
- imports of goods increased 0.0% (£0.0 billion) to £18.1 billion
The United Kingdom non-EU-UK Goods balance of trade deficit widened by £0.9 billion to £2.3 billion
- exports of goods increased 2.0% (£0.3 billion) to £14.8 billion
- imports of goods increased 7.8% (£1.2 billion) to £17.1 billion
Year-over-year (Aug 2020 vs Aug 2019, seasonally adjusted )
- The United Kingdom EU-UK Goods balance of trade deficit narrowed by £1.3 billion and
- non-EU-UK Goods balance of trade deficit narrowed by £0.2 billion
GOODS TRADE BY SECTOR
Year-to-date (Jan-Aug 2020 )
NET TRADE
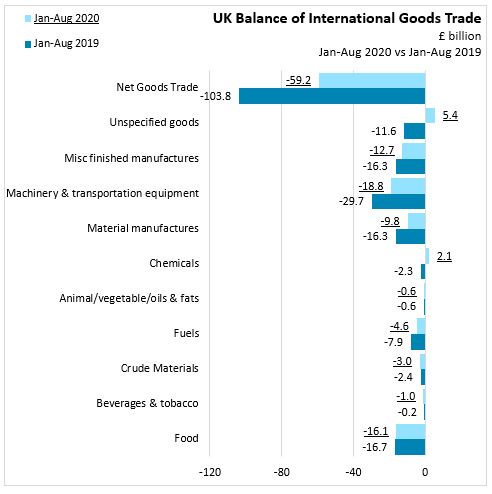
The Total trade deficit narrowed by £1,513.0 million to £9.0 billion
- Food deficit narrowed by £223.0 million to £1.8 million
- Beverages & tobacco changed from a surplus (£22.0 million) to a deficit (£50.0 million)
- Crude Materials deficit widened by £110.0 million to £0.439 billion
- Fuels deficit narrowed by £692.0 million to £0.068 billion
- Animal/vegetable/oils & fats deficit widened by £15.0 million to £0.067 billion
- Chemicals surplus widened by £330.0 million to £0.393 billion
- Material manufactures deficit narrowed by £374.0 million to £1.2 billion
- Machinery & transport equip deficit narrowed by £1,754.0 million to £1.9 billion
- Miscellaneous finished manufactures deficit widened by £59.0 million to £1.7 billion
- Unspecified goods deficit widened by £1,604.0 million to £2.2 billion
EXPORTS
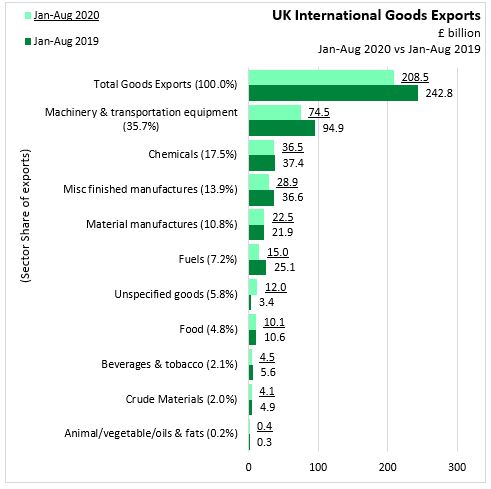
Total Goods Exports decreased £34,344 millions to £208.5 billions.
- Machinery & transportation equipment decreased £20,408 millions to £74.5 billions.
- Chemicals decreased £895 millions to £36.5 billions.
- Miscellaneous finished manufactures decreased £7,653 millions to £28.9 billions.
- Material manufactures increased £630 millions to £22.5 billions.
- Fuels decreased £10,095 millions to £15.0 billions.
- Unspecified goods increased £8,609 millions to £12.0 billions.
- Food decreased £539 millions to £10.1 billions.
- Beverages & tobacco decreased £1,174 millions to £4.5 billions.
- Crude Materials decreased £817 millions to £4.1 billions.
- Animal/vegetable/oils & fats increased £17 millions to £.4 billions.
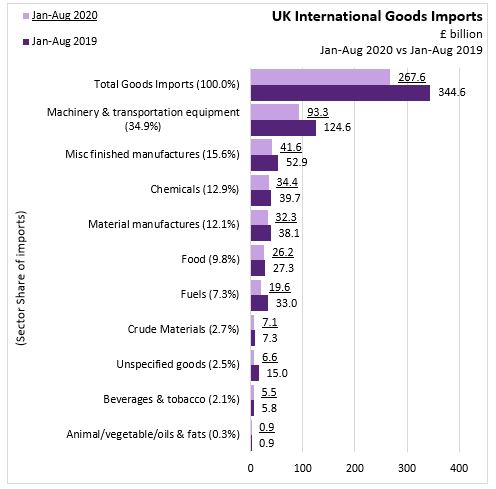
IMPORTS
Total Goods Imports decreased £76,951 millions to £267.6 billions.
- Machinery & transportation equipment decreased £31,298 millions to £93.3 billions.
- Miscellaneous finished manufactures decreased £11,249 millions to £41.6 billions.
- Chemicals decreased £5,237 millions to £34.4 billions.
- Material manufactures decreased £5,836 millions to £32.3 billions.
- Food decreased £1,120 millions to £26.2 billions.
- Fuels decreased £13,374 millions to £19.6 billions.
- Crude Materials decreased £187 millions to £7.1 billions.
- Unspecified goods decreased £8,355 millions to £6.6 billions.
- Beverages & tobacco decreased £314 millions to £5.5 billions.
- Animal/vegetable/oils & fats increased £19 millions to £0.9 billions.
Source: UK Office for National Statistics, Statistical Bulletin | Time Series | Time Series Explorer
<--- Return to Archive