The Economics and Statistics Division maintains archives of previous publications for accountability purposes, but makes no updates to keep these documents current with the latest data revisions from Statistics Canada. As a result, information in older documents may not be accurate. Please exercise caution when referring to older documents. For the latest information and historical data, please contact the individual listed to the right.
<--- Return to Archive
For additional information relating to this article, please contact:
October 09, 2020LABOUR MARKET TRENDS - SEPTEMBER 2020 Labour force survey results reflect the period from September 13 to 19, as families adapted to new back-to-school routines, public health restrictions had been substantially eased, and more workplaces re-opened.
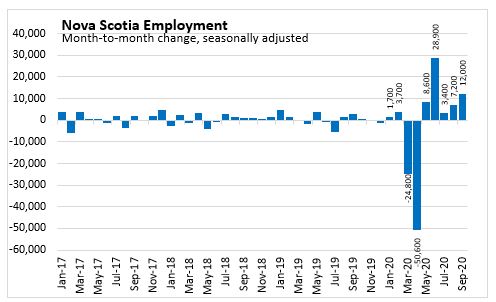
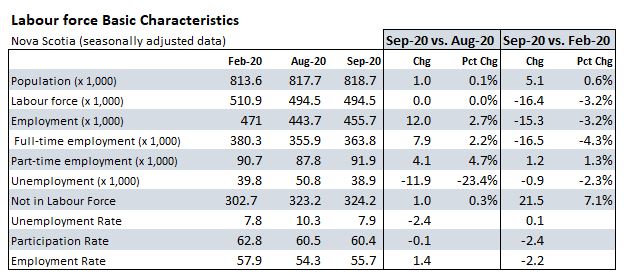
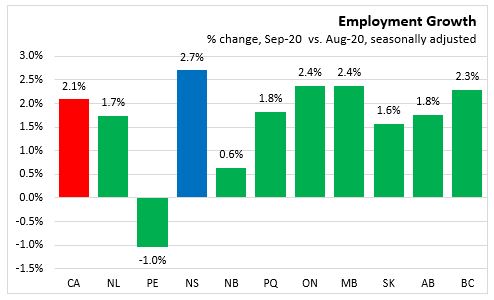
Nova Scotia's seasonally adjusted employment level was up 12,000 (+2.7%) in September following on the recovery of 39,500 jobs in the previous four months. Nova Scotia’s employment had previously declined 50,600 in April and 24,800 in March.
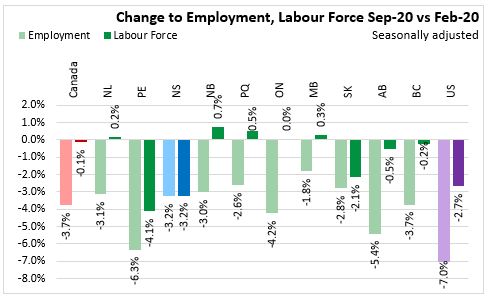
Nova Scotia’s employment remains 15,300 (-3.2%) lower than pre-COVID-19 levels in February 2020. Nova Scotia has recovered about 80 per cent (60,100) of the peak employment losses reported in April (-75,400). In comparison, Canada has recovered about 64 per cent (1.27 million) of April peak employment losses (-1.99 million).
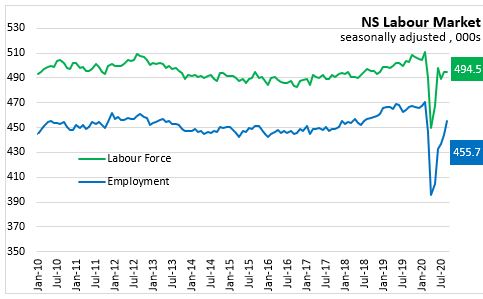
Nova Scotia’s labour force was unchanged (0.0%) at 494,500 for September. The labour force in September 2020 is smaller by 16,400 (-3.2%) than February 2020. The number of unemployed persons was down 11,900 compared to August and is 900 persons lower than February.
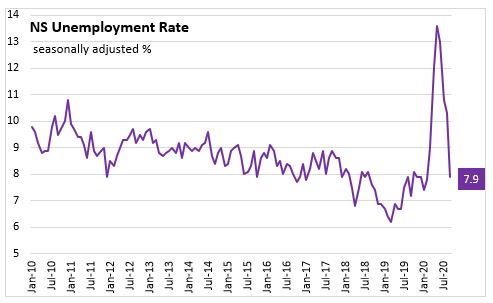
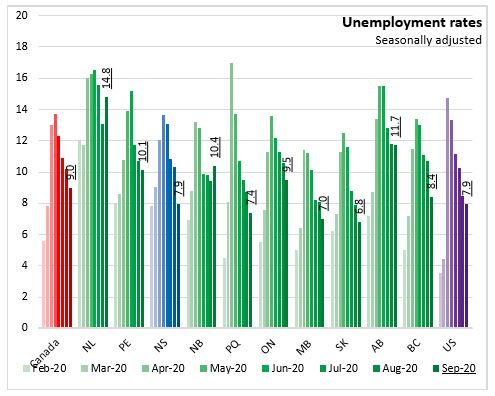
With employment growing faster and unchanged labour force, the unemployment rate decreased 2.4 percentage points last month to 7.9 per cent September. This is slightly higher than the unemployment rate observed prior to COVID-19 (7.8 per cent in February), although the participation rate remains lower.
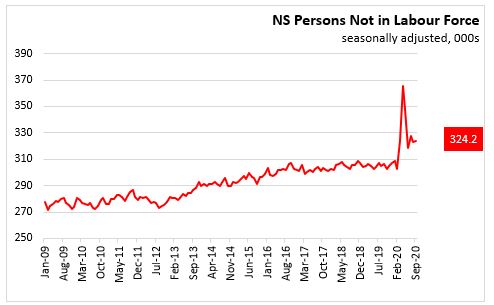
The population not in the labour force increased 1,000 compared to last month. Compared to February 2020, there are an additional 21,500 persons not in the labour force and 900 fewer unemployed.
In September, full-time employment increased 7,900 (2.2%) while part-time employment increased 4,100 (+4.7%). Employment since February 2020 is lower by 16,500 (-4.3%) in full-time jobs and higher by 1,200 (+1.3%) in part-time employment. Changes in the number of hours worked, can results in change in part-time vs. full-time employment.
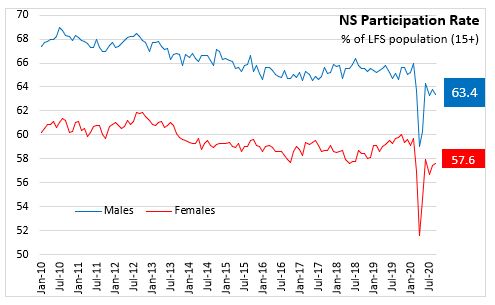
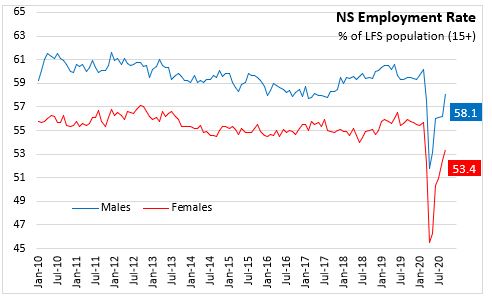
The participation rate was down 0.1 percentage points in September and is 2.4 percentage points below the level observed in February 2020. The employment rate was up 1.4 percentage points to 55.7 per cent in September 2020 but remains 2.2 percentage points below February 2020.
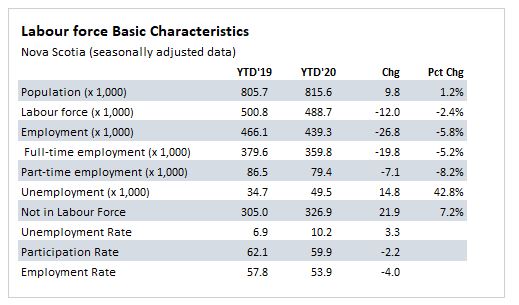
Comparing averages for Jan-Sep 2020 with Jan-Sept 2019, Nova Scotia labour force has decreased 2.4 per cent and employment has been lower by 5.8 per cent. The average unemployment rate is 3.3 percentage points higher at 10.2 per cent.
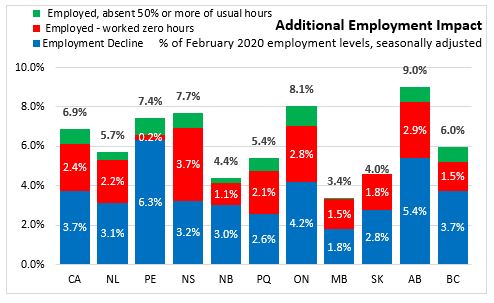
In addition to those who have lost employment since February 2020, there are elevated numbers of persons who are counted as employed, but had zero hours (and not for routine reasons like vacation, maternity/parental leave, labour dispute) or had their hours cut by 50 per cent or more. In September 2020 in Nova Scotia there were 40,600 persons employed but at less than 50 per cent of their usual hours (including zero hours), up from 34,200 in August and still elevated compared to 19,700 in February. Combined with those who have lost their employment, this amounts to about 7.7 per cent of Nova Scotia’s February 2020 employment level; down from a high of 26.3 per cent in May. The largest total employment/hour impact in September 2020 was in Alberta at 9.0 per cent of February's employment level. The smallest change was in Manitoba (3.4%).
Statistics Canada reported in supplemental information that Nova Scotia had an increase of 6,200 (Feb-20 to Sep-20) of people who were not in the labour force but wanted to work to 24,600 people. This is down from the 55,500 people in April 2020.
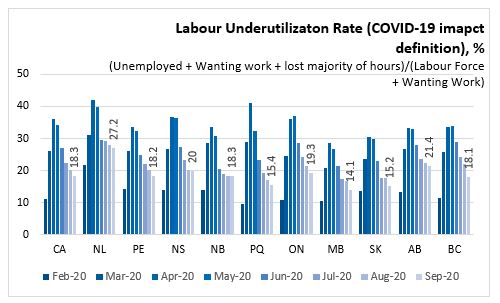
The labour underutilization rate (COVID-19 impact definition) is the proportion of the potential labour force (labour force + those wanting work) that is unemployed, not in labour force but wanted work or employed but have lost the majority of their usual hours.
Rising labour underutilization observed in every province during March and April has started to come down over the summer months. In February 2020, Nova Scotia's labour underutilization rate was 13.9 per cent. This underutilization increased to 36.8 per cent in April 2020 and has subsequently fallen to 20.0 per cent in September 2020. The current highest labour underutilization rate is in Newfoundland and Labrador (27.2%) and the lowest rate is in Manitoba (14.1%).
Age Cohorts
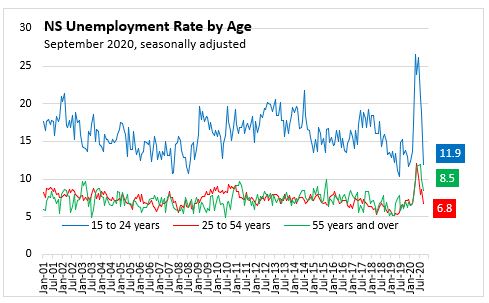
From August to September, unemployment rates declined 7.0 percentage points to 11.9 per cent for youth (ages 15-24), 1.8 percentage points to 6.8 percent for core-aged workers (ages 25-54), and 1.4 percentage points to 8.5 per cent for older workers (ages 55+). The youth unemployment rate is now below pre-COVID levels while the unemployment rate for core aged workers is now 0.1 percentage points higher than in February 2020. However, part of the recovery in unemployment rates is explained by lower participation rates.
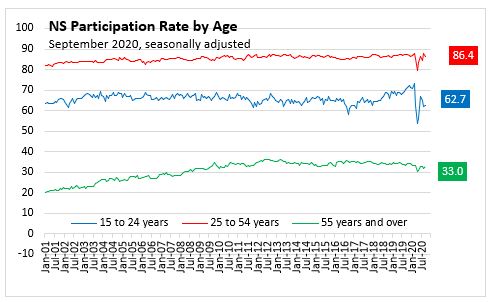
The participation rate for younger Nova Scotians increased 0.8 percentage points to 62.7 per cent in September 2020. However, the participation rate for core-aged Nova Scotians was down 1.4 percentage points to 86.4 per cent in September. For older workers, the participation rate increased 1.0 per cent to 33.0 per cent.
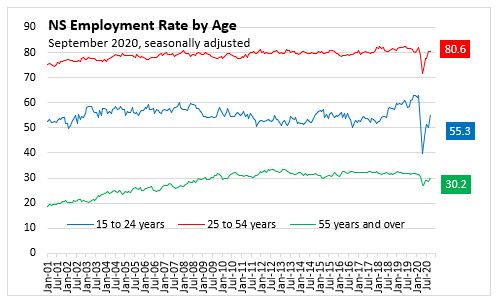
Compared to the previous month, employment rates increased in all age cohorts with the younger workers posting the largest gain. Employment rates for youth increased by 5.1 percentage points, by 0.3 percentage points for core-aged Nova Scotians. For older workers, the employment rate increased 1.4 percentage points in September.
Compared with February 2020, employment rates were down for youth (-7.7 percentage points), core-aged workers (-1.5 percentage points) and older workers (-1.1 percentage points).
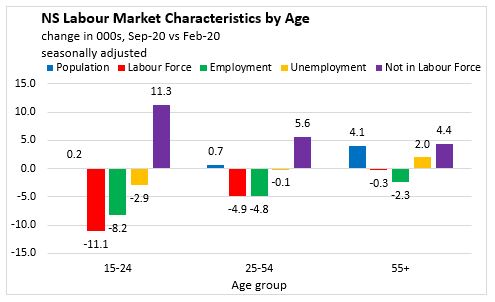
Comparing August to September 2020, the decline in employment mostly lines up with declines in labour force for youth and core-aged workers. For older workers, the decline in employment shows up in increased unemployment instead of a decrease in the labour force.
Males and Females
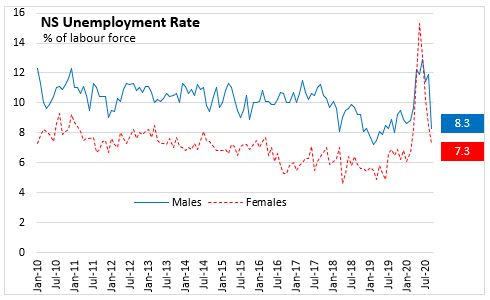
For September the monthly unemployment rate declined 3.6 percentage points to 8.3 per cent for males and 1.2 percentage points to 7.3 per cent for females.
The monthly participation rate increased 0.2 percentage points to 57.6 per cent for females but declined 0.4 percentage points to 63.4 per cent for males.
The employment rate was up 1.9 percentage points for males and 0.9 percentage points for females.
Compared with February 2020, male labour force is down 8,900 (-3.4%) while female labour force is down 7,400 (-3.0%). Male employment is down 6,900 (-2.9%) while female employment is down 8,400 (-3.6%). The number of unemployed is up 1,000 for females and down 2,000 for males. The male population not in the labour force increased by 11,400 while the number of females not in the labour force increased by 10,000.

Sectors and Industries
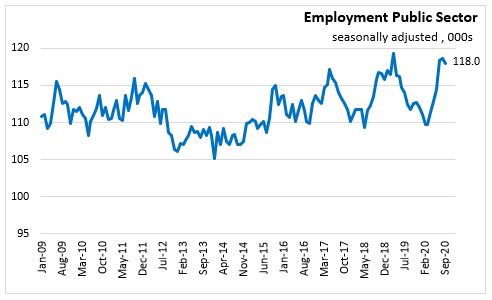
The monthly employment increases in September were among private sector (+8,800) employees and self-employment (+3,900). Public sector employees were down 600. Compared to February 2020, employment remains lower in the private sector (25,500) while public sector employment (+8,300) and self-employment (+1,900) are higher.
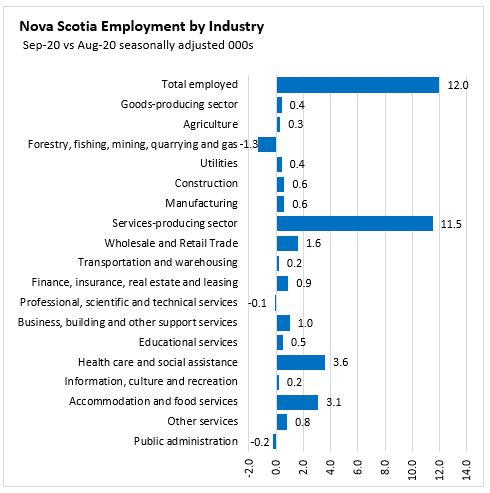
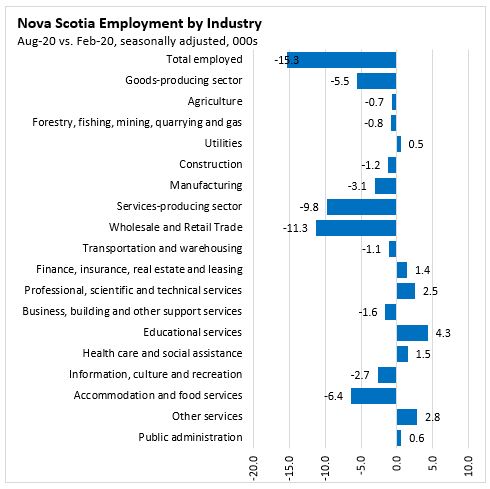
For September 2020, goods-producing sector employment (+400) increased as a decline in forestry, fishing, and mining (-1,300) was offset by smaller gains in the other goods industries. Service-producing sector employment gained 11,500 jobs with the largest number health care and social assistance (including day cares) (+3,600), accommodation and food services (+3,100), and wholesale and retail trade (+1,600).
Employment since February 2020 remains 5,500 lower in goods-producing industries with the lower employment levels in manufacturing (-3,100), construction (-1,200), forestry, fishing and mining (-800), and agriculture (-700). Service-producing employment is lower by 9,800 since February 2020 with the lower levels in wholesale and retail trade (-11,300) and accommodation and food service (-6,400) accounting for the largest number of job losses that have not been recovered.
Employment levels in September 2020 are also lower in transportation and warehousing (-1,100), building, building and other support services (-1,600), information, culture and recreation (-2,700) than February 2020.
Employment levels are higher in September 2020 than February 2020 in educational services (+4,300), professional, scientific, and technical services (+2,500), personal/repair (other) services (+2,800), health care and social assistance (+1,500), and finance and insurance (+1,400).


Regions – September 2020 vs September 2019 (unadjusted 3 month moving average)
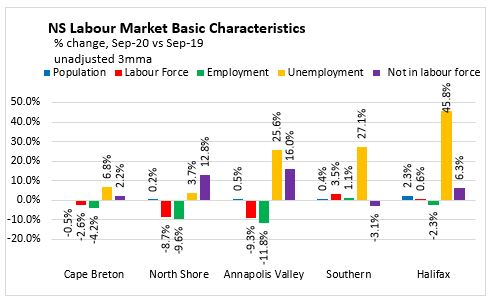
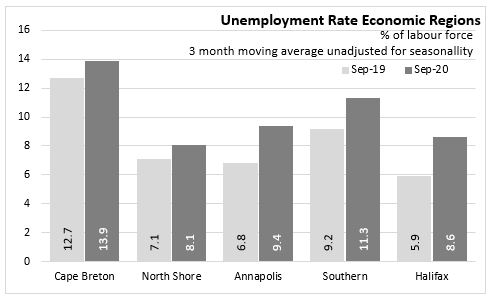
Compared with September 2019, Cape Breton employment is down 2,100 while the labour force is down 1,500. The number of unemployed increased by 500 and the unemployment rate increased 1.2 percentage points to 13.9 per cent.
For the North Shore region, the labour force declined by 6,600 while employment was down by 6,700. With the labour force decline a bit shy of employment decline, the number of unemployed increased by 200. The unemployment rate increased 1.0 percentage points to 8.1 per cent.
The Annapolis Valley reported a decline of 5,900 in the labour force and a decline of 7,000 in employment. Unemployment was up by 1,100. As a result, the unemployment rate increased 2.6 percentage points to 9.4 per cent.
When compared to September 2019, the Southern region experienced an increase of 1,800 in labour force and an increase of 500 in employment. The number of unemployed increased by 1,300. As such, the unemployment rate increased by 2.1 percentage points to 11.3 per cent.
Halifax recorded an increase of 1,500 in the labour force while employment was down by 5,600. With unemployment increasing by 7,100, the unemployment rate increased 2.7 percentage points to 8.6 per cent. The number of persons not in the labour force increased by 7,100 in Halifax from a year ago.

Provincial Comparisons
All provinces, except Prince Edward island, report increases in employment in September. The largest employment increases was in Nova Scotia (+2.7%) and nationally employment was up 2.1 per cent.
Compared to February 2020, the labour force remains lower in five provinces. The largest decline in the labour force since February 2020 has been in Prince Edward Island(-4.1%).
The largest employment decline since February is Prince Edward Island (-6.3%) and Alberta (-5.4%). The smallest employment decline since February 2020 is in Manitoba (-1.8%).
Unemployment rates declined in September 2020 in all the provinces, except Newfoundland and Labrador and New Brunswick. The highest unemployment rate for September 2020 is in Newfoundland and Labrador at 14.8 per cent and the lowest is in Saskatchewan at 6.8 per cent. Canada’s unemployment rate was 9.0 per cent in September 2020.
National Comparisons: Cities (Monthly, 3 month moving average)
The unemployment rate for Halifax Census Metropolitan Area (CMA) in September 2020 was 8.4 per cent (seasonally adjusted 3 month moving average). Quebec city at 5.0 per cent had the lowest unemployment rate among CMAs while the highest was in Toronto (12.8 per cent).

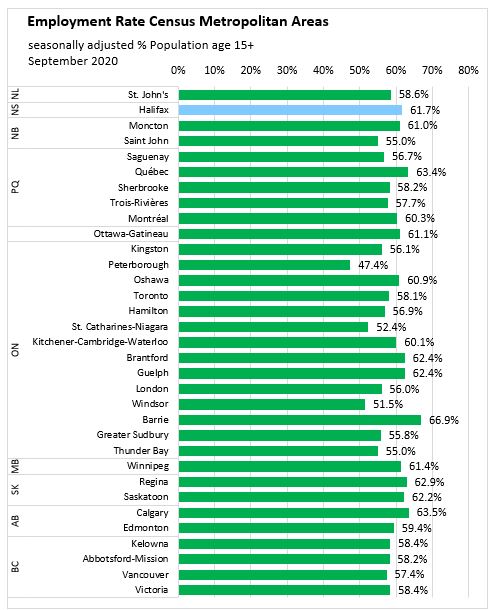
The seasonally adjusted employment rate for Halifax was 61.7 per cent, up 0.7 percentage points compared to last month. Peterborough, Ontario (47.4 per cent) had the lowest employment rate, while Barrie, Ontario (66.9 per cent) had the highest.
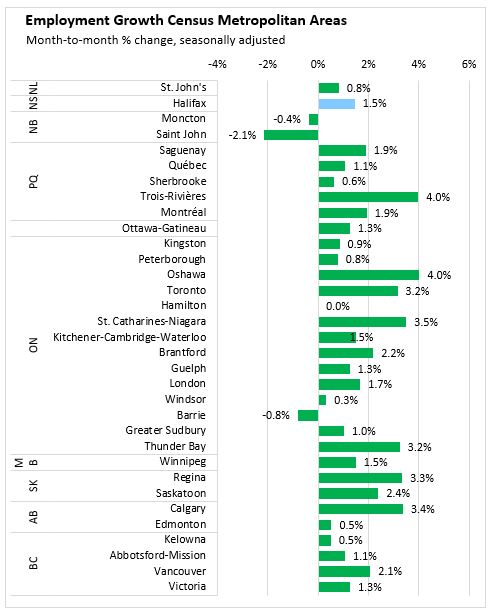
Halifax’s employment (3 month moving average) for September 2020 was up 1.5 percent compared to the August 2020 result. The employment level (Jul-Sep average compared to Jun-Aug average) was up in nearly all CMAs this month with the largest increase in Trois-Rivieres and Oshawa (4.0%).

Note: Seasonally adjusted, 3 month average.
Sources:
Statistics Canada. Table 14-10-0287-01 Labour force characteristics, monthly, seasonally adjusted and trend-cycle, last 5 months
Statistics Canada. Table 14-10-0294-01 Labour force characteristics by census metropolitan area, three-month moving average, seasonally adjusted and unadjusted, last 5 months
Statistics Canada. Table 14-10-0293-01 Labour force characteristics by economic region, three-month moving average, unadjusted for seasonality, last 5 months
Statistics Canada. Table 14-10-0355-01 Employment by industry, monthly, seasonally adjusted and unadjusted, and trend-cycle, last 5 months (x 1,000)
Statistics Canada. Table 14-10-0288-01 Employment by class of worker, monthly, seasonally adjusted and unadjusted, last 5 months (x 1,000)
<--- Return to Archive