The Economics and Statistics Division maintains archives of previous publications for accountability purposes, but makes no updates to keep these documents current with the latest data revisions from Statistics Canada. As a result, information in older documents may not be accurate. Please exercise caution when referring to older documents. For the latest information and historical data, please contact the individual listed to the right.
<--- Return to Archive
For additional information relating to this article, please contact:
October 21, 2020NEW HOUSING PRICE INDEX, SEPTEMBER 2020 SEPTEMBER 2020
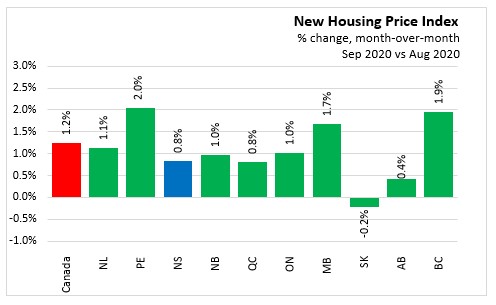
New housing prices in Nova Scotia increased 0.8 per cent month over month in September 2020.
Nationally, new home prices increased 1.2 per cent month-over-month in September following a 0.5 per cent gain in August. This was the largest monthly increase in 14 years.
Statistics Canada noted that home prices were up due to increased demand for single-family homes and higher building material costs. Looking ahead, the shortage of lumber and building supplies due to increased homebuyer demand and renovation activities is expected to continue to put upward pressure on new house prices.
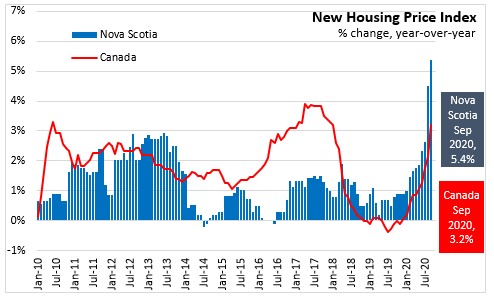
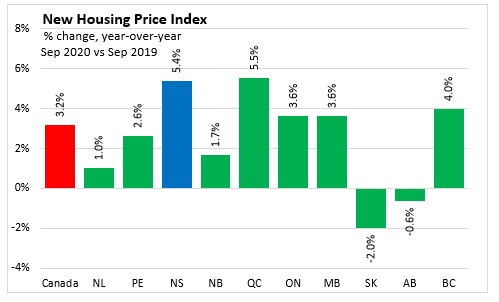
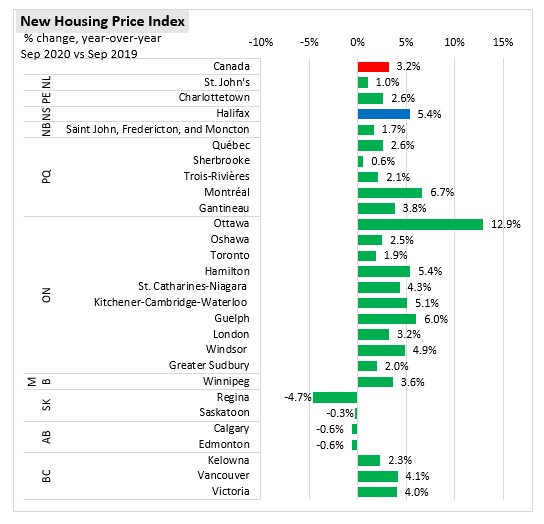
Year-over-Year (September 2020 vs September 2019)
New housing prices in Nova Scotia increased 5.4 per cent year-over-year in September. This was the fastest year-over-year growth in Nova Scotia since November 2008 and the second largest annual growth across all provinces, just behind Quebec (+5.5%).
In Canada, new house prices increased 3.2 per cent year-over-year in August recording the largest annual growth since January 2018. New housing prices were lower in Saskatchewan (-2.0%), and Alberta (-0.6%).
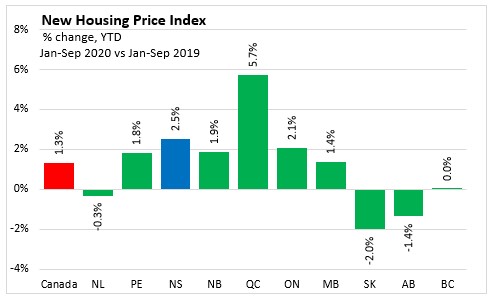
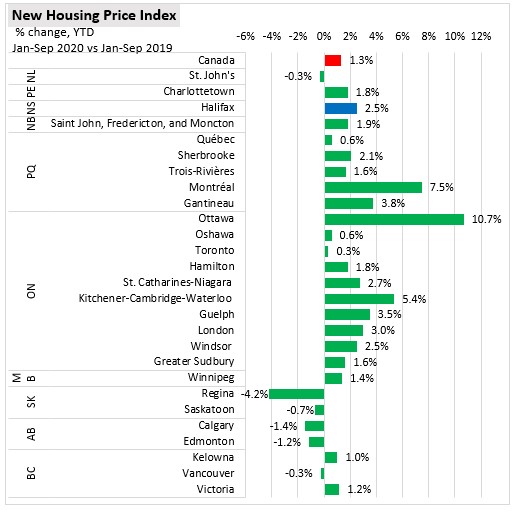
Year to date, Nova Scotia new housing prices were up 2.5 per cent in the first nine months of 2020. National new housing prices increased 1.3 per cent in January-September 2020 compared to January-September 2019. Quebec saw the fastest growth in new housing prices at 5.7 per cent. The largest decline was in Saskatchewan where new housing prices fell 2.0 per cent compared to the first nine months of 2019.
Census Metropolitan Areas
In September, new home prices increased year-over-year in the majority of the Census Metropolitan Areas. The fastest growth was recorded in Ottawa (+12.9%) and Montreal (+6.7%). Low inventory and high demand have continued to push prices up in these two CMAs for the past two years.
Prices in Halifax were 5.4 per cent higher compared to September 2019.
New house prices declined in Regina (-4.7%), Calgary (-0.6%), Edmonton (-0.6%) and Saskatoon (-0.3%).
New housing prices in Halifax increased 2.5 per cent in the first nine months of 2020 compared to the same period last year. The largest growth was recorded in Ottawa (+10.7%) followed by Montreal (+7.5%).
Compared to the January-September 2019, Regina (-4.2%), Calgary (-1.4%) and Edmonton (-1.2%) recorded the largest declines in new housing prices. Prices were also down in Saskatoon, Vancouver, and St. John’s.
New housing prices may continue to rise as demand for single-family homes remains high, as buyers continue looking for larger living spaces. The higher cost of building materials, combined with historically low mortgage rates, could further contribute to the rise in new housing prices.
Statistics Canada Note: With the release of the January 2017 NHPI data, a number of important changes have been introduced to increase the relevance of the index series. The index base period, for which the NHPI equals 100, is now December 2016. The NHPI basket has been updated with new weights for the 2017 series, its coverage has been expanded to include new CMAs.
Source Statistics Canada. Table 18-10-0205-01 New housing price index, monthly
<--- Return to Archive