The Economics and Statistics Division maintains archives of previous publications for accountability purposes, but makes no updates to keep these documents current with the latest data revisions from Statistics Canada. As a result, information in older documents may not be accurate. Please exercise caution when referring to older documents. For the latest information and historical data, please contact the individual listed to the right.
<--- Return to Archive
For additional information relating to this article, please contact:
October 22, 2020CULTURE AND SPORT INDICATORS, 2018 Statistics Canada has updated indicators of Canada's culture and sport activities for 2018.
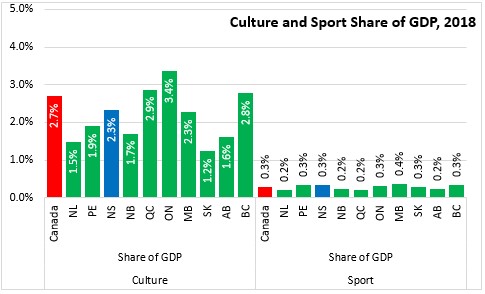
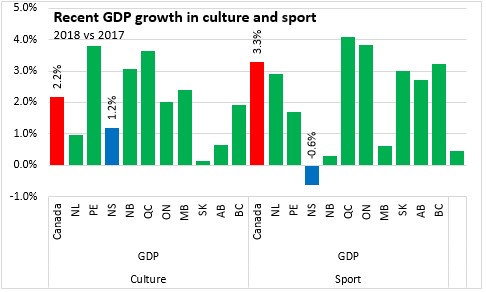
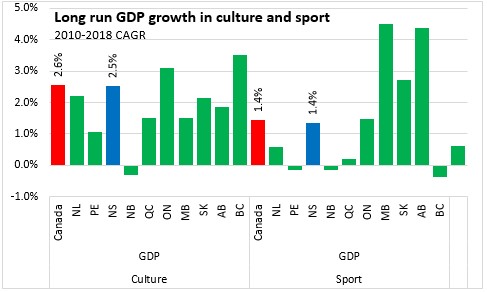
Nova Scotia's GDP from culture in 2018 was $942.7 million (at current prices), or 2.3% of provincial GDP. This is up 1.2% from revised results for 2017. Since 2010, Nova Scotia culture GDP has grown at an annual average pace of 2.5%, just below the national average.
GDP from sport in Nova Scotia was $134.1 million; 0.3 per cent of provincial GDP. Sport GDP in Nova Scotia was down 0.6% from revised 2017 results. Nova Scotia was the only province to report declining GDP from sport in 2018. Since 2010, Nova Scotia's sport GDP has grown at an annual average rate of 1.4%, just below the national average.
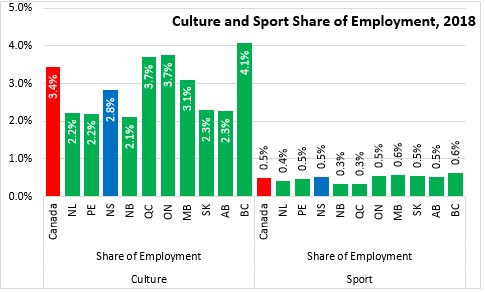
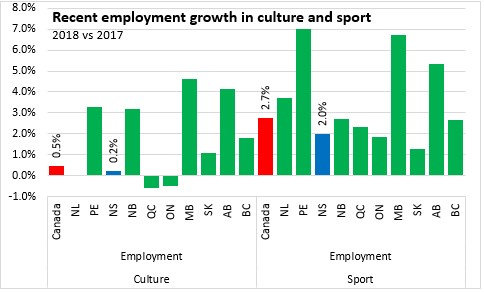
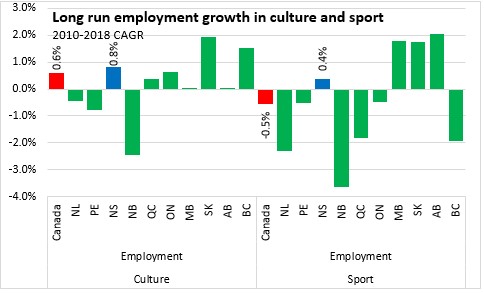
Culture employment was 13,116 in 2018 or 2.8% of provincial employment. Nova Scotia's culture employment was up 0.2% from revised results for 2017. Since 2010, culture employment in Nova Scotia has grown at an annual average rate of 0.8%, which is faster than the national average.
Sport employment in Nova Scotia was 2,455 or 0.5% of provincial employment. Sport employment grew by 2.0% from 2017, which is faster than the long run pace of 0.4% per year.
Notes: culture and sport share of GDP are calculated using GDP by income, adjusted for taxes less subsidies on products and imports; employment shares calculated using job totals from labour productivity tables
Source: Statistics Canada.
Table 36-10-0452-01 Culture and sport indicators by domain and sub-domain, by province and territory, product perspective (x 1,000)
Table 17-10-0009-01 Population estimates, quarterly
Table 36-10-0221-01 Gross domestic product, income-based, provincial and territorial, annual (x 1,000,000)
Table 36-10-0480-01 Labour productivity and related measures by business sector industry and by non-commercial activity consistent with the industry accounts
<--- Return to Archive