The Economics and Statistics Division maintains archives of previous publications for accountability purposes, but makes no updates to keep these documents current with the latest data revisions from Statistics Canada. As a result, information in older documents may not be accurate. Please exercise caution when referring to older documents. For the latest information and historical data, please contact the individual listed to the right.
<--- Return to Archive
For additional information relating to this article, please contact:
October 29, 2020EMPLOYMENT, EARNINGS AND HOURS, AUGUST 2020 PAYROLL EMPLOYMENT
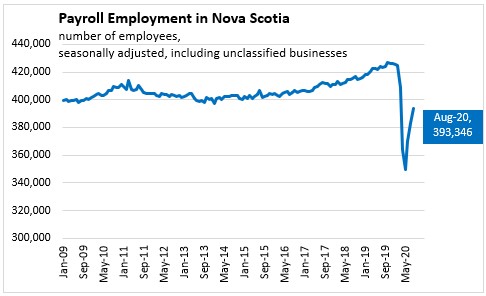
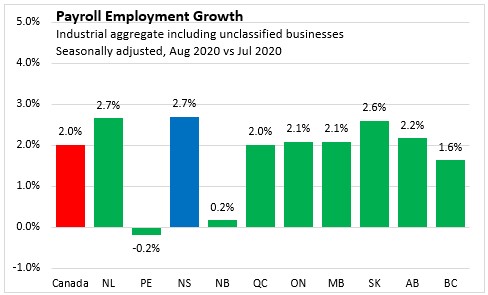
Nova Scotia had 393,346 payroll employees in August, an increase of 2.7 per cent (+10,305) compared to July 2020, and down 7.1 per cent (-30,158) compared to last August. Nova Scotia's payroll employment had been trending upwards since 2017 but declined sharply after February due to restrictions and closures resulting from COVID-19 and partially rebounded in August, July, and June due to eased restrictions.
Canada had 15.4 million employees, an increase of 2.0 per cent (+303,217) compared to last month and down 9.4 per cent (-1,599,686) compared to a year ago.
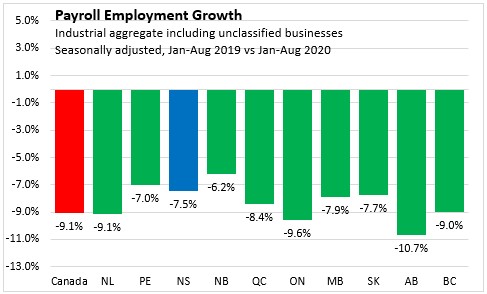
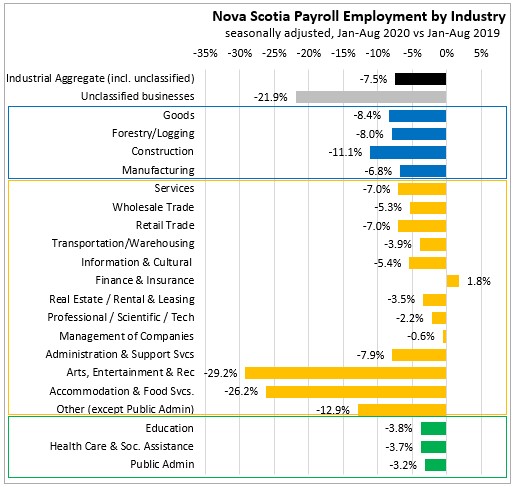
Compared to Jan-Aug 2019, Nova Scotia's payroll employment is down 7.5 per cent. Nationally, payroll employment is down 9.1 per cent in Jan-Aug 2020, with all provinces reporting decreases. The largest payroll employment decline has been observed in Alberta (-10.7 per cent), Ontario (-9.6 per cent) followed by Newfoundland and Labrador (-9.1 per cent) and British Columbia (-9.0 per cent). The smallest declines have been in the Maritimes: New Brunswick (-6.2%), Prince Edward Island (-7.0%) and Nova Scotia (-7.5%).
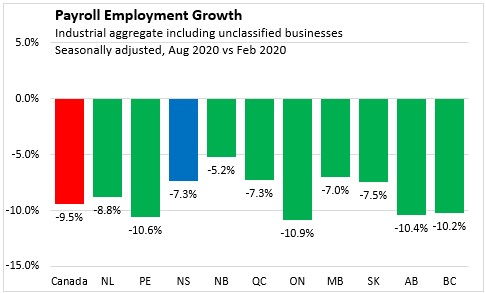
Compared to February 2020, Nova Scotia's payroll employment is down 7.3 per cent. Nationally, payroll employment is down 9.5 per cent in August 2020, with all provinces reporting decreases. The largest payroll employment decline has been observed in Ontario (-10.9 per cent), Prince Edward Island (-10.6 per cent), followed by Alberta (-10.4 per cent) and British Columbia (-10.2 per cent).
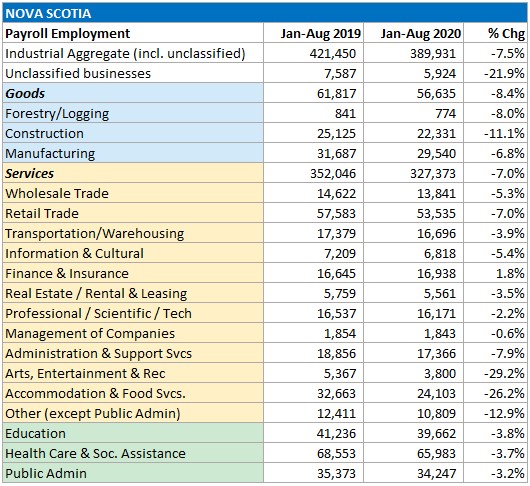
In Jan-Aug 2020, payroll employment was down 8.4 per cent in Nova Scotia's goods producing sectors compared to Jan-Aug 2019. Goods sector payroll employment was down for manufacturing (-6.8 per cent), construction (-11.1 per cent) and forestry/logging (-8.0 per cent) sectors compared to Jan-Aug 2019.
Service sector employment was down 7.0 per cent in Jan-Aug 2020 compared to Jan-Aug 2019. Service sector payroll employment decreased the most in percentage terms in arts/entertainment/recreation (-29.2 per cent), accommodation and food services (-26.2 per cent), and other services (except public administration) (-12.9 per cent). Payroll employment increased only in finance and insurance (+1.8 per cent).
AVERAGE WEEKLY EARNINGS
Changes in average weekly earnings reflect wage growth as well as changes in the composition of employment by industry/occupation/experience, and average hours worked per week. During COVID-19, large employment losses have been reported in industries with relatively low average weekly earnings. This means that average weekly earnings rises because those remaining employed are working in industries with higher average weekly earnings.

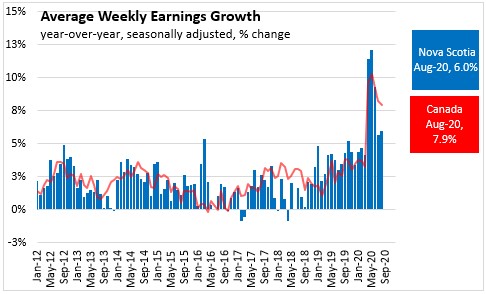
Nova Scotians' average weekly earnings (including overtime, seasonally adjusted) increased 1.0 per cent ($9.72) from July 2020 to $962.38 in August 2020. Average weekly wages were up 6.0 per cent compared with August 2019. Canadians' average weekly wages remained stable at 0.0 per cent month to month ($1,114.37 in August) and were 7.9 per cent higher than they were a year ago.
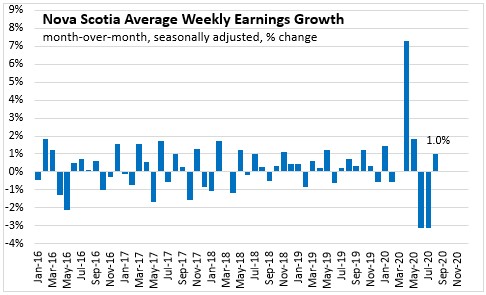
Across the country, there are monthly increases in six provinces, with the largest increases in Saskatchewan (+1.6 per cent), Nova Scotia (+1.0 per cent) and Newfoundland and Labrador (+1.0 per cent). The largest declines were reported in Manitoba (-1.5 per cent) and New Brunswick (-0.7 per cent).
Compared to a year ago, average wages were higher in all provinces, with the largest increases in percentage terms reported in Prince Edward Island (+10.4 per cent), Quebec (+9.1 per cent), Ontario (+9.0 per cent) and British Columbia (+9.0 per cent). The slowest year-over-year growth in average weekly earnings was observed in Alberta (+4.1 per cent) and Manitoba (+4.3 per cent).

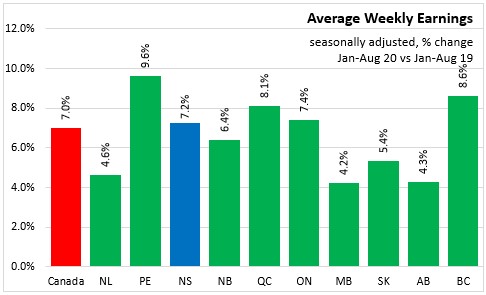
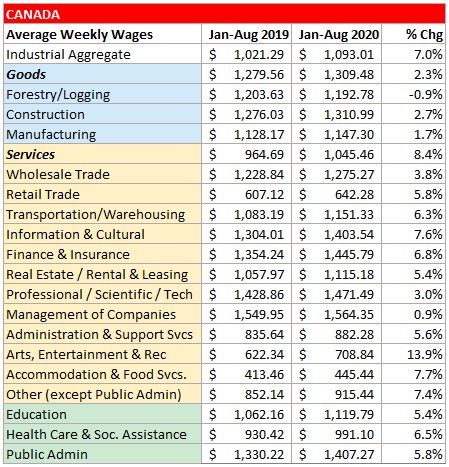
Compared to Jan-Aug 2019, Nova Scotia's average wages were up 7.2 per cent. Nationally, average wages were up 7.0 per cent in Jan-Aug 2020. Average wages were higher in all provinces, with the largest increases in percentage terms reported in Prince Edward Island (+9.6 per cent), British Columbia (+8.6 per cent), and Quebec (+8.1 per cent). The slowest growth in average weekly earnings was observed in Manitoba (+4.2 per cent), Alberta (+4.3 per cent), and Newfoundland and Labrador (+4.6 per cent).
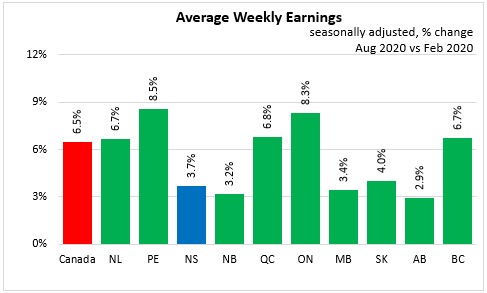
Compared to February 2020, Nova Scotia's average wages were up 3.7 per cent. Nationally, average wages were up 6.5 per cent in August 2020. Average wages were higher in all provinces, with the largest increases in percentage terms reported in Prince Edward Island (+8.5 per cent), Ontario (+8.3 per cent), and Quebec (+6.8 per cent). The slowest growth in average weekly earnings was observed in Alberta (+2.9 per cent).
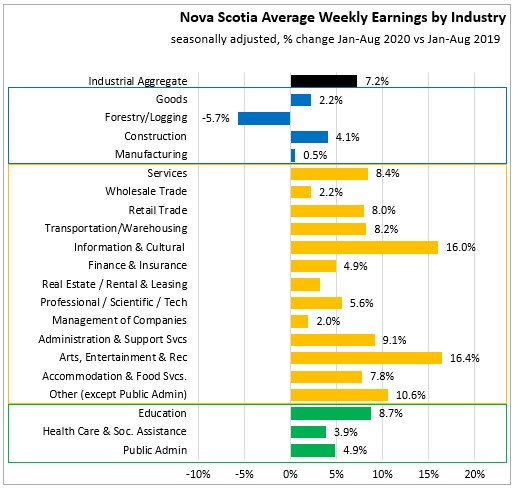
In Jan-Aug 2020 (compared to Jan-Aug 2019), average weekly earnings were up 2.2 per cent in Nova Scotia's goods producing sectors. Goods sector wages were up for construction and manufacturing sector and lower in forestry and logging. Service sector average earnings were up 8.4 per cent in Jan-Aug 2020. Service sector earnings increased the most in percentage terms in arts, entertainment & recreation (+16.4 per cent) and information & culture (+16.0 per cent).
REFERENCE TABLES - (Jan-Aug 2020 vs Jan-Aug 2019)


Source: Statistics Canada. Table 14-10-0222-01 Employment, average hourly and weekly earnings (including overtime), and average weekly hours for the industrial aggregate excluding unclassified businesses, monthly, seasonally adjusted; Table 14-10-0223-01 Employment and average weekly earnings (including overtime) for all employees by province and territory, monthly, seasonally adjusted
<--- Return to Archive