The Economics and Statistics Division maintains archives of previous publications for accountability purposes, but makes no updates to keep these documents current with the latest data revisions from Statistics Canada. As a result, information in older documents may not be accurate. Please exercise caution when referring to older documents. For the latest information and historical data, please contact the individual listed to the right.
<--- Return to Archive
For additional information relating to this article, please contact:
November 12, 2020UK TRADE BALANCE, SEPTEMBER 2020
UK TRADE BALANCE
Month-over-month (Sep 2020 vs Aug 2020, seasonally adjusted )
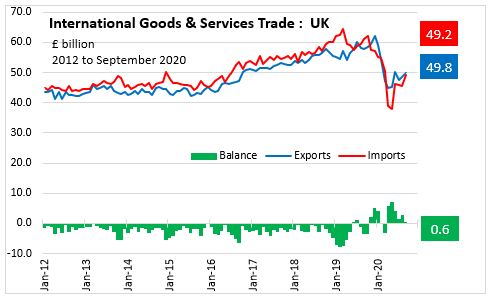
The United Kingdom Goods and services balance of trade surplus narrowed by £2.2 billion to £0.6 billion
- exports of goods and services increased 2.6% (£1.3 billion) to £49.8 billion
- imports of goods and services increased 7.7% (£3.5 billion) to £49.2 billion
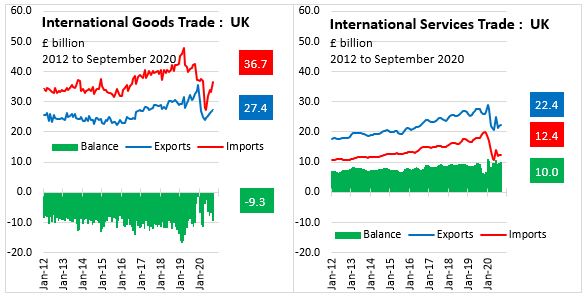
The United Kingdom Goods balance of trade deficit widened by £2.5 billion to £9.3 billion
- exports of goods increased 3.3% (£0.9 billion) to £27.4 billion
- imports of goods increased 10.2% (£3.4 billion) to £36.7 billion
The United Kingdom Services balance of trade surplus widened by £0.3 billion to £10.0 billion
- exports of services increased 1.7% (£0.4 billion) to £22.4 billion
- imports of services increased 0.8% (£0.1 billion) to £12.4 billion
Year-over-year (Sep 2020 vs Sep 2019, seasonally adjusted )
The United Kingdom Goods and services balance of trade surplus changed from a deficit (£3.4 billion) to a surplus (£0.6 billion) and
- Goods balance of trade deficit narrowed by £2.0 billion and
- Services balance of trade surplus widened by £2.0 billion
TRADING PARTNERS
Month-over-month (Sep 2020 vs Aug 2020, seasonally adjusted )
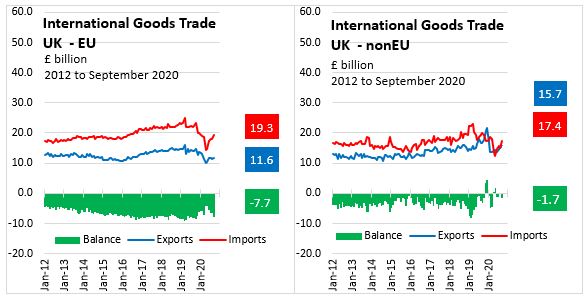
The United Kingdom EU-UK Goods balance of trade deficit widened by £1.1 billion to £7.7 billion
- exports of goods increased 0.9% (£0.1 billion) to £11.6 billion
- imports of goods increased 6.5% (£1.2 billion) to £19.3 billion
The United Kingdom non-EU-UK Goods balance of trade deficit widened by £1.4 billion to £1.7 billion
- exports of goods increased 5.2% (£0.8 billion) to £15.7 billion
- imports of goods increased 14.6% (£2.2 billion) to £17.4 billion
Year-over-year (Sep 2020 vs Sep 2019, seasonally adjusted )
The United Kingdom
- EU-UK Goods balance of trade deficit narrowed by £0.6 billion and
- non-EU-UK Goods balance of trade deficit narrowed by £1.5 billion
GOODS TRADE BY SECTOR
Year-to-date (Jan-Sep 2020 ) Goods Trade by Sector
NET TRADE
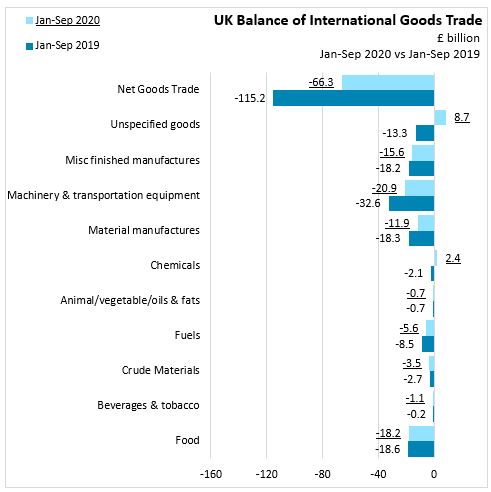
The Total goods trade deficit narrowed by £48.9 billion to £66.3 billion
- Food deficit widened by £428 million to £18.2 million
- Beverages & tobacco deficit widened by £963 million to £1.1 billion
- Crude Materials deficit widened by £803 million to £3.5 billion
- Fuels deficit narrowed by £3.0 billion to £5.6 billion
- Animal/vegetable/oils & fats deficit widened by 6 million to £2.4 billion
- Chemicals changed from a deficit to a surplus 0f 2.4 billion
- Material manufactures deficit narrowed by £8.0 million to £11.9 billion
- Machinery & transport equip deficit narrowed by £11.7 billion to £20.9 billion
- Miscellaneous finished manufactures deficit narrowed by £2.6 billion to £15.6 billion
- Unspecified goods changed from a deficit to a surplus (£8.7 billion)
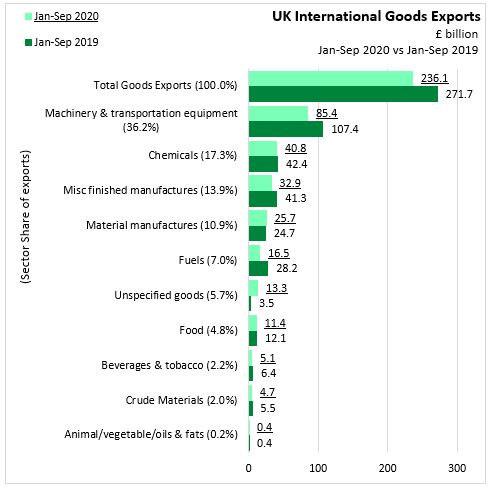
EXPORTS
Total Goods Exports decreased £35.6 billions to £236.1 billions.
- Machinery & transportation equipment decreased £21,967 millions to £85.4 billions.
- Chemicals decreased £1,550 millions to £40.8 billions.
- Miscellaneous finished manufactures decreased £8,413 millions to £32.9 billions.
- Material manufactures increased £1,013 millions to £25.7 billions.
- Fuels decreased £11,773 millions to £16.5 billions.
- Unspecified goods increased £9,836 millions to £13.3 billions.
- Food decreased £694 millions to £11.4 billions.
- Beverages & tobacco decreased £1,243 millions to £5.1 billions.
- Crude Materials decreased £822 millions to £4.7 billions.
- Animal/vegetable/oils & fats increased £13 millions to £.4 billions.
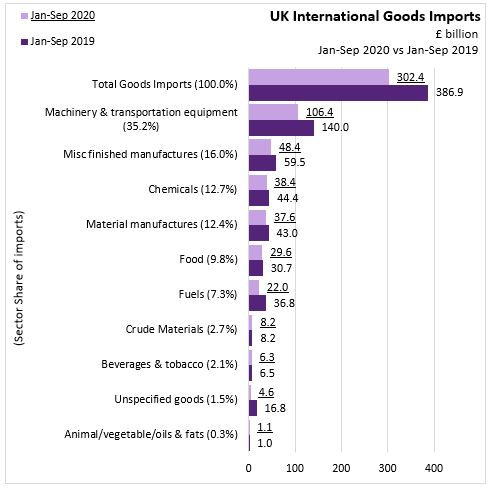
IMPORTS
Total Goods Imports decreased £84,492 millions to £302.4 billions.
- Machinery & transportation equipment decreased £33,650 millions to £106.4 billions.
- Miscellaneous finished manufactures decreased £11,055 millions to £48.4 billions.
- Chemicals decreased £6,005 millions to £38.4 billions.
- Material manufactures decreased £5,407 millions to £37.6 billions.
- Food decreased £1,122 millions to £29.6 billions.
- Fuels decreased £14,752 millions to £22.0 billions.
- Crude Materials decreased £19 millions to £8.2 billions.
- Beverages & tobacco decreased £280 millions to £6.3 billions.
- Unspecified goods decreased £12,221 millions to £4.6 billions.
- Animal/vegetable/oils & fats increased £19 millions to £1.1 billions.
Source: UK Office for National Statistics, Statistical Bulletin | Time Series | Time Series Explorer
<--- Return to Archive