The Economics and Statistics Division maintains archives of previous publications for accountability purposes, but makes no updates to keep these documents current with the latest data revisions from Statistics Canada. As a result, information in older documents may not be accurate. Please exercise caution when referring to older documents. For the latest information and historical data, please contact the individual listed to the right.
<--- Return to Archive
For additional information relating to this article, please contact:
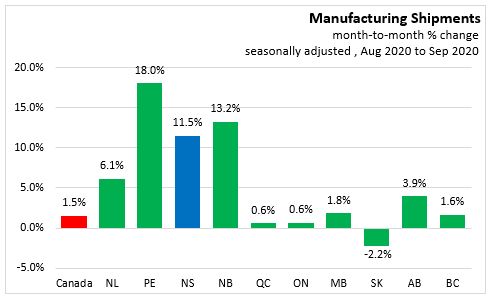
November 16, 2020MANUFACTURING SHIPMENTS, SEPTEMBER 2020 Month over month (seasonally adjusted, Aug 2020 to Sep 2020)
Nova Scotia manufacturing shipments increased 11.5% to 787.2 million. Non-durable shipments were $491.9 million while durable shipments were $295.3 million.
In Canada, manufacturing shipments increased 1.5% to $53.8 billion. Overall sales decreased in 8 of 21 industries representing 25.7% of all manufacturing sectors. Durable goods increased 1.2% to $28.9 billion, decreasing 5.2% over September 2019. Non-durable goods increased 1.9% to $24.9 billion, decreasing 7.4% over September 2019.
Manufacturing sales increased in 9 provinces. Prince Edward Island had the largest growth at 18.0% . The only province to report a decline was Saskatchewan at -2.2%.
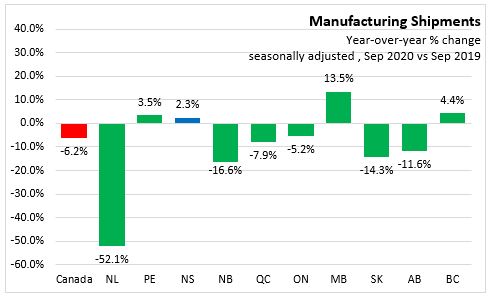
Year over year (seasonally adjusted, Sep 2020 vs Sep 2019)
Nova Scotia shipments increased 2.3%. Durable goods increased 10.8% ($28.8 million). Non-durable goods decreased 2.2% (-$11.3 million).
In Canada shipments decreased 6.2%. Durable goods decreased 5.2% (-$1.6 billion). Non-durable goods decreased 7.4% (-$2.0 billion).
Manufacturing sales increased in 9 provinces. Manitoba had the largest growth at 13.5%. Newfoundland and Labrador shipment growth decreased 52.1%.
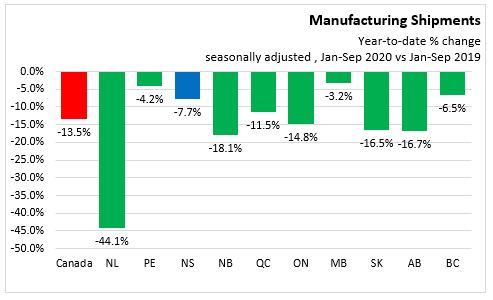
Year to date (seasonally adjusted, Jan-Sep 2020 vs Jan- Sep 2019)
In Nova Scotia Manufacturing Shipments decreased 7.7% (-$533.8 million) to $6.4 billion. Non-durable goods industries decreased 10.1% (-$480.7 million) to $4.3 billion. Durable goods industries decreased 2.4% (-$53.1 million) to $2.1 billion.
In Canada Manufacturing Shipments decreased -13.5% (-$70.3 million) to $449.2 billion. Non-durable goods industries decreased 11.2% (-$27.4 million) to $217.2 billion. Durable goods industries decreased 15.6% (-$42.9 billion) to $232 billion.
Manufacturing sales were negative in all provinces. Manitoba had the smallest decline at -3.2%. Newfoundland and Labrador had the greatest decline at 44.1%.
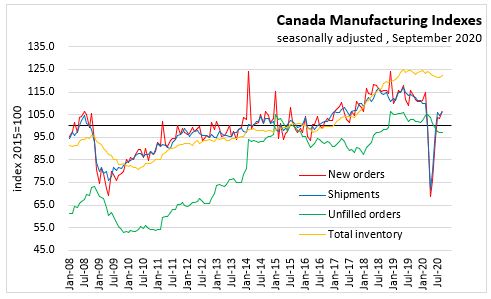
Trends
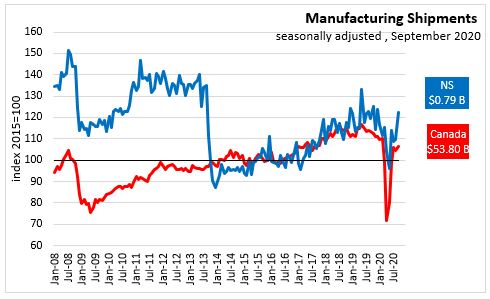
As of September, Nova Scotia's manufacturing shipments were up 9.3% over Feb20 levels. National manufacturing shipments were 3.6% below Feb20 levels. Among provinces, only Nova Scotia, Manitoba and British Columbia manufacturing shipments have recovered to Feb20 levels.
In September Canada's new orders for manufacturing increased by 3.6%, while unfilled orders fell by 0.3%. Manufacturing inventories rose by 0.7%.
NOVA SCOTIA SECTORS
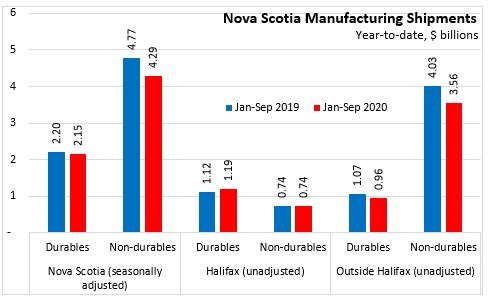
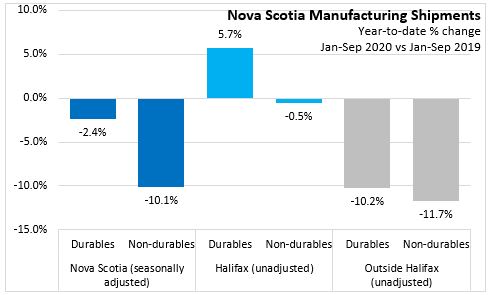
Year to date (seasonally adjusted, Jan-Sep 2020 vs Jan- Sep 2019)
In Nova Scotia Manufacturing Shipments decreased 7.7% (-$533.8 million) to $6.4 billion. Durable goods industries decreased 2.4% (-$53.1 million) to $2.1 billion. Non-durable goods industries decreased 10.1% (-$480.7 million) to $4.3 billion.
Year to date (unadjusted, Jan-Sep 2020 vs Jan- Sep 2019)
In Halifax Durable goods industries increased 5.7% ($64.4 million) to $1.2 billion. Non-durable goods industries decreased 0.5% (-$3.9 million) to $740.3 million.
In Outside Halifax Durable goods industries decreased 10.2% (-$108.6 million) to $0.9 billion. Non-durable goods industries decreased 11.7% (-$469.9 million) to $3.6 billion.
SOURCES
Statistics Canada Monthly survey of Manufacturing
Statistics Canada. Table 16-10-0047-01 Manufacturers' sales, inventories, orders and inventory to sales ratios, by industry (dollars unless otherwise noted)
Statistics Canada. Table 16-10-0048-01 Manufacturing sales by industry and province, monthly (dollars unless otherwise noted) (x 1,000)
Statistics Canada. Table 16-10-0011-01 Manufacturing sales, by industry for 12 Selected Census Metropolitan Areas (x 1,000)
<--- Return to Archive