The Economics and Statistics Division maintains archives of previous publications for accountability purposes, but makes no updates to keep these documents current with the latest data revisions from Statistics Canada. As a result, information in older documents may not be accurate. Please exercise caution when referring to older documents. For the latest information and historical data, please contact the individual listed to the right.
<--- Return to Archive
For additional information relating to this article, please contact:
November 20, 2020NEW HOUSING PRICE INDEX, OCTOBER 2020 OCTOBER 2020
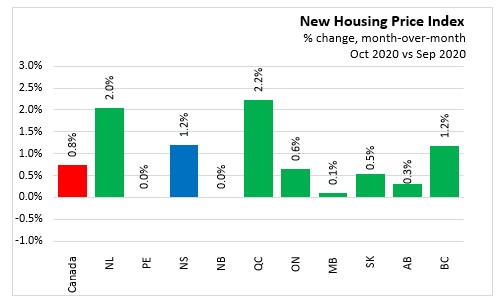
New housing prices in Nova Scotia increased 1.2% month over month in October 2020.
Nationally, new home prices were up 0.8% month-over-month in October following a 1.2% gain in September. Across Canada, new home price increased 3.1% since the start of the COVID-19 pandemic in March, a much stronger growth compared to the 0.1% increase experience from March to October in 2019.
Statistics Canada noted that lower borrowing costs and increased demand for single-family homes contributed to the increase in new home prices this year. It is expected that the combination of these factors will continue to put upward pressure on new home prices in the near term.
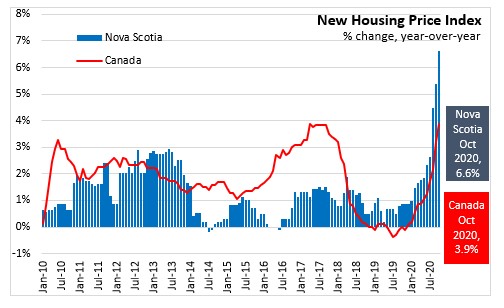
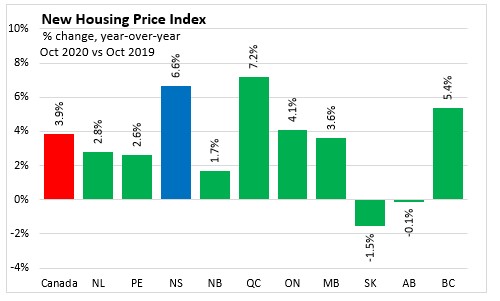
New housing prices in Nova Scotia increased 6.6% year-over-year in October, posting the second largest annual growth across provinces just behind Quebec (+7.2%). This was the fastest year-over-year growth in Nova Scotia since November 2008.
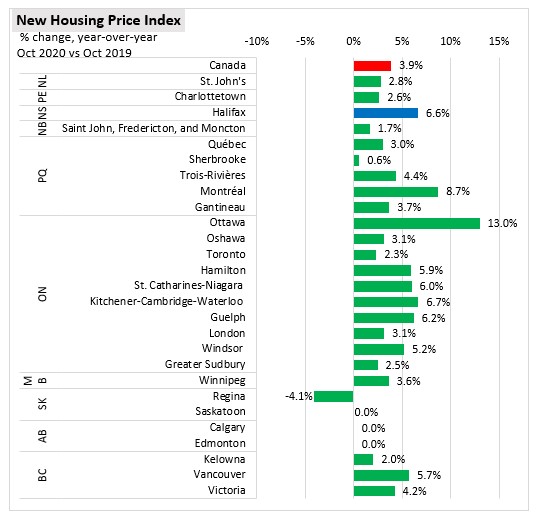
In Canada, new house prices increased 3.9% year-over-year in October recording the largest annual growth since June 2017. New housing prices were lower in Saskatchewan (-1.5%), and Alberta (-0.1%).
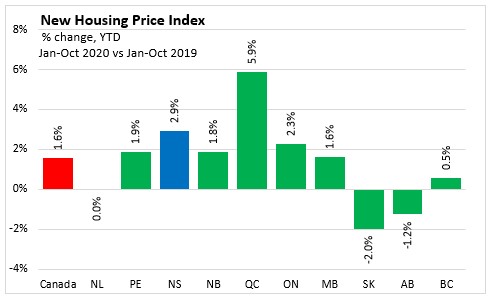
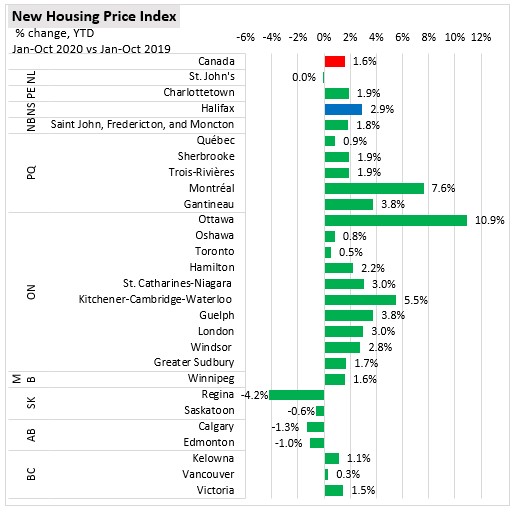
Year to date, new home prices in Nova Scotia increased 2.9% in the first ten months of 2020. National home prices were up 1.6% during the same period. Quebec recorded the largest increase at 5.9% while Saskatchewan experienced the largest decline at -2.0%.
Census Metropolitan Areas
Yea-over-year, new home prices increased or stayed flat in majority of the Census Metropolitan Areas in October except for Regina. The fastest growth was recorded in Ottawa (+13.0%), fastest annual growth since June 2001 and Montreal (+6.7%), largest annual gain in October since February 2003. Low inventory and high demand have continued to push prices up in these two CMAs for the past two years.
Prices in Halifax were 6.6% higher compared to October 2019.
New home prices declined 4.1% year-over-year in Regina.
From January to October 2020, new home prices in Halifax increased 2.9% compared to the same period in 2019. Across Census Metropolitan Areas, the largest growth was recorded in Ottawa (+10.9%) and Montreal (+7.6%).
Compared to the January-October 2019, Regina (-4.2%), Calgary (-1.3%), Edmonton (-1.0%) and Saskatoon (-0.6%) recorded annual declines in new housing prices. Prices stayed the same in St. John’s.
Statistics Canada Note: With the release of the January 2017 NHPI data, a number of important changes have been introduced to increase the relevance of the index series. The index base period, for which the NHPI equals 100, is now December 2016. The NHPI basket has been updated with new weights for the 2017 series, its coverage has been expanded to include new CMAs.
Source Statistics Canada. Table 18-10-0205-01 New housing price index, monthly
<--- Return to Archive