The Economics and Statistics Division maintains archives of previous publications for accountability purposes, but makes no updates to keep these documents current with the latest data revisions from Statistics Canada. As a result, information in older documents may not be accurate. Please exercise caution when referring to older documents. For the latest information and historical data, please contact the individual listed to the right.
<--- Return to Archive
For additional information relating to this article, please contact:
November 24, 2020FOOD SERVICES AND DRINKING PLACES, SEPTEMBER 2020
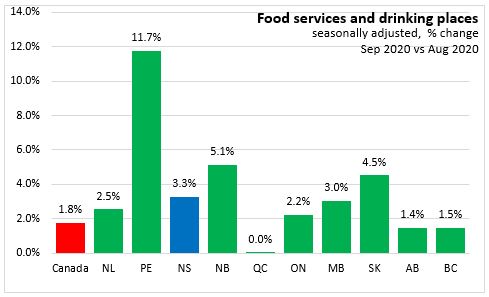
Month-over-Month (Sep 2020 vs Aug 2020, seasonally adjusted)
- Nova Scotia food services and drinking places receipts increased 3.3% to $119.5 million.
- Canada's food services and drinking places receipts increased 1.8% to $5.1 billion.
- All provinces reported monthly increases in food services and drinking places, with
- Prince Edward Island (11.7%) reporting the largest gain, and
- Quebec (0.03%) reporting the smallest gain in percentage terms.
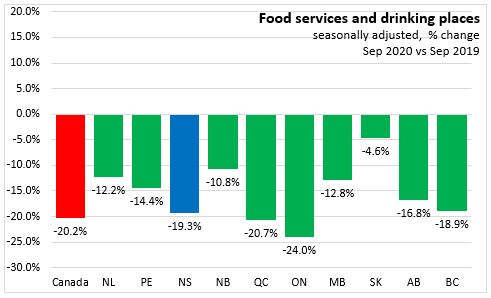
Year-over-Year (Sep 2020 vs Sep 2019, seasonally adjusted)
- Nova Scotia food services and drinking places receipts decreased 19.3%.
- Canada's food services and drinking places receipts decreased 20.2%.
- All of the provinces reported year-over-year decreases in food services and drinking place receipts, with
- Saskatchewan (-4.6%) reporting the smallest decline and
- Ontario (-24.0%) reporting the largest decline in percentage terms.

Year-to-Date (Jan-Sep 2019 vs Jan-Sep 2020, seasonally adjusted)
- Nova Scotia food services and drinking places receipts decreased 25.4% (-$335.4 million).
- Canada's food services and drinking places receipts decreased 27.0% (-$15.5billion).
- All of the provinces reported year-to-date decreases in food services and drinking place receipts, with
- Saskatchewan (-17.7%) reporting the smallest decline and
- Ontario (-30.3%) reporting the largest decline in percentage terms.
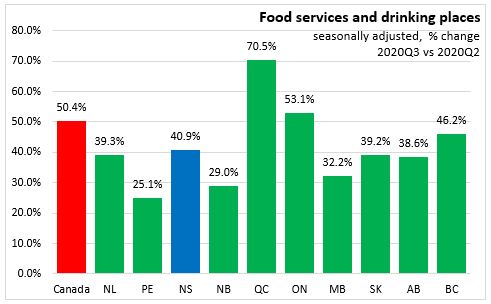
Quarter-over-quarter (2020Q3 vs 2020Q2, seasonally adjusted)
- Nova Scotia food services and drinking places receipts increased 40.9% ($101.2 million).
- Canada's food services and drinking places receipts increased 50.4% ($5.0billion).
- All provinces reported quarter over quarter increases in food services and drinking place receipts, with
- Prince Edward Island (25.1%) reporting the smallest gain and
- Quebec (70.5%) reporting the largest gain in percentage terms.
Long-run Trend
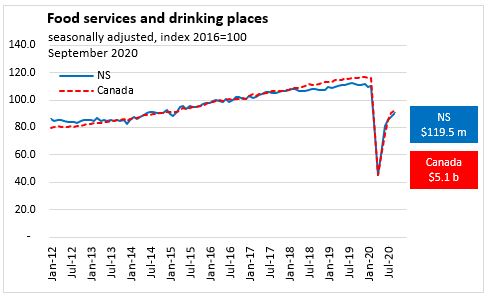
Canada and Nova Scotia (2012 to 2020, seasonally adjusted)
Nova Scotia's Food services and drinking places month over month sales declined sharply in March 2020 (-32.5%) and April 2020 (-38.7%). Recovery began with rapid gains in May 2020 (+31.8%) and June 2020 (+34.7%). Compared to February 2020, Nova Scotia's September 2020 Food services and drinking places sales were still -18.0% below their pre-pandemic levels.
National food services and drinking places sales continued to rebound for the fifth consecutive month but are still -20.6% below pre-pandemic levels. All provinces report food services and drinking places sales remain between -6.9 % to -24.5% below February 2020 levels.
NOVA SCOTIA SECTORS
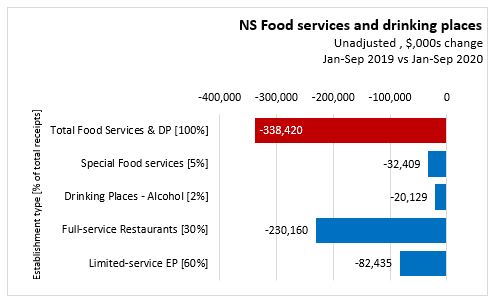
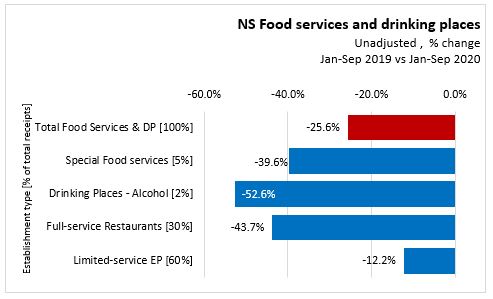
Nova Scotia Year-to-date Sales by Establishment Type (Jan- Sep 2020 vs Jan-Sep 2019, unadjusted for seasonality)
Compared with Jan-Sep 2019, the reductions in food service and drinking place receipts have been most pronounced for Nova Scotia's full-service resturants (-$230.2 million). In year-to-date percentage terms, the declines have been more severe for drinking places (-52.6%) and full-service restaurants (-43.7%), with a smaller decline for limited service eating places (-12.2%).
- Limited-service eating places, decreased 12.2% (-$82.4 million)
- Full-service restaurants decreased 43.7% (-$230.2 million)
- Special food services decreased 39.6% (-$32.4 million)
- Drinking places -alcoholic beverages decreased 52.6% (-$20.1 million)
Source: Statistics Canada. Table 21-10-0019-01 Monthly survey of food services and drinking places (x 1,000)
<--- Return to Archive