The Economics and Statistics Division maintains archives of previous publications for accountability purposes, but makes no updates to keep these documents current with the latest data revisions from Statistics Canada. As a result, information in older documents may not be accurate. Please exercise caution when referring to older documents. For the latest information and historical data, please contact the individual listed to the right.
<--- Return to Archive
For additional information relating to this article, please contact:
December 01, 2020NON-RESIDENTIAL FIXED CAPITAL INVESTMENT, Q3 2020 Non-residential fixed capital investment consists of expenditures made by business, governments and non-profit institutions serving households that add to the capital stock for production of goods and services in an economy. Investments that are included are: buildings, engineering construction (i.e. bridge, mine structure), machinery and equipment, and intellectual property products (i.e. software, mineral exploration) but it doesn’t include non-reproducible assets (lands, mineral deposits, natural resources) or housing investment. Statistics Canada has begun to release quarterly data on non-residential fixed capital investment and stock for the provinces with historical data back to 2013. Note, the data is not seasonally adjusted and expressed in current prices.
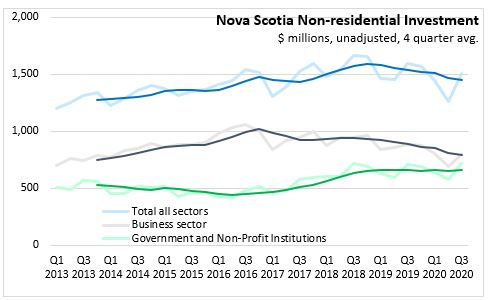
Nova Scotia non-residential investment has trended upwards since Q1 2013, rising from $1,201 million in Q1 2013 to a high $1,667 million in Q3 2018, before declining to $1,568 in Q4 2019 . Non-residential investment declined to $1,445 million in Q1, and $1,264 million in Q2 and then increased to $1,512 million in Q3 2020. Business sector non-residential investment has declined to a greater extent in 2020 than the government sector. Government and non-profit institution serving households was mostly flat from 2013 through 2017 but has been at consistent higher level since 2018.
Within the business sector, machinery and equipment account for nearly 50% of non-residential investment. Business sector Machinery and equipment was down 11.8% compared to Q3 2019, an improvement compared to Q2. For Q3 2020 compared to Q3 2019, business sector investment was higher in non-residential buildings (+1.3%) and lower in engineering construction (-19.5%), and intellectual property products (-3.4%).

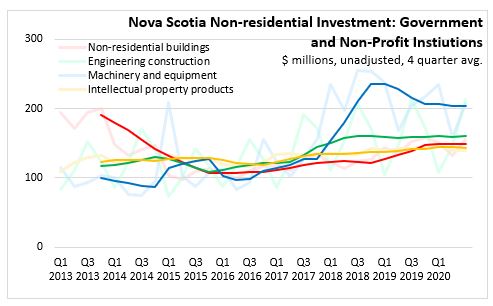
Government investment in machinery and equipment rose through 2018 and has maintained an elevated levels though 2019 averaging around $230 million per quarter. For Q3 2020 compared to Q3 2019 , government and non-profit investment has increased 0.8% cent with small increases among buildings (+2.6%), engineering construction (+0.5%), machinery and equipment (+1.0%) offsetting intellectual property products (-2.1%).
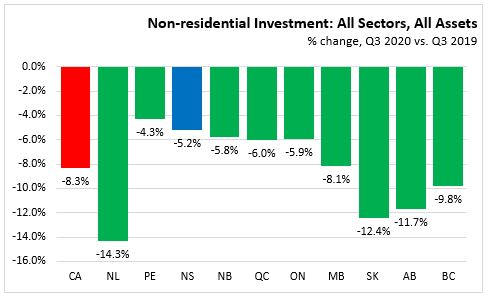
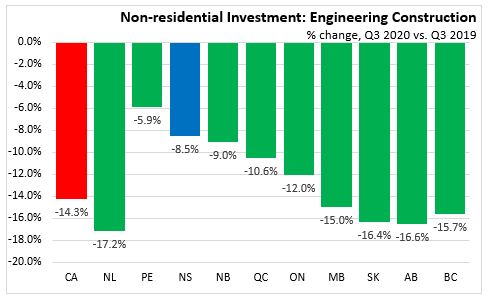
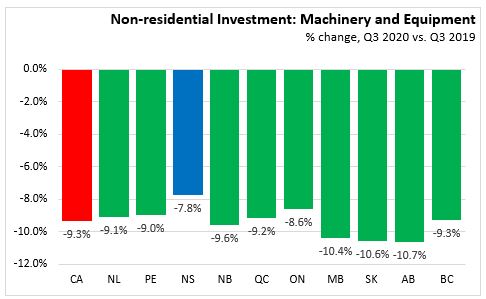
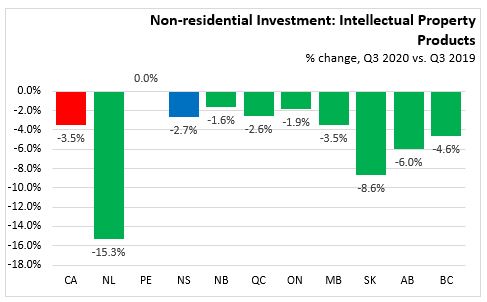
PROVINCES NON-RESIDENTIAL INVESTMENT: Q3 2020 vs. Q3 2019
Total investment is down 8.3% in Canada and 5.2% in Nova Scotia compared to Q3 2019. The largest declines have been in Newfoundland and Labrador (-14.3%), Saskatchewan (-12.4%), Alberta (-11.7%) and British Columbia (-9.8%).
Within the business sector, all provinces reported lower investment in Q3 2020. Nova Scotia non-residential investment is 10.1% lower than Q3 2019 and nationally business investment is 12.1% lower. The largest declines were in Newfoundland and Labrador (-18.0%), Saskatchewan (-15.3%), Alberta (-14.5%) and British Columbia (-13.5%).

Government and non-profit fixed capital investment is higher in all provinces in Q3 2020. Most provinces have increased similar to the national 1.5% increase. The smallest increase was in Nova Scotia (+0.8%).

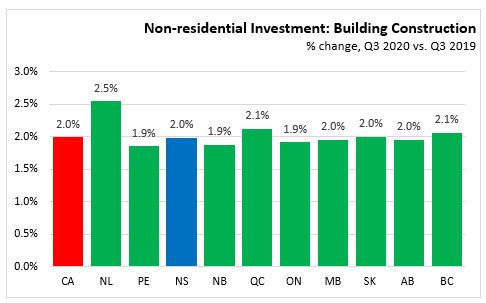
For Q3 2020 compared to Q3 2019, non-residential investment in buildings was up for all provinces by a similar amount.
Engineering structures investment, across all sectors, declined in all provinces in Q3 2020 compared to Q3 2019. The smallest declines in Prince Edward Island (-5.9%) and Nova Scotia (-8.5%).
Machinery and equipment, across all sectors, declined 9.3% in Canada and all provinces reported declines. The smallest decline was in Nova Scotia (-7.8%) and the largest in Alberta (-10.7%), Saskatchewan (-10.6%) and Manitoba (-10.4%).
Intellectual property products decreased in all provinces, except Prince Edward Island where it was unchanged. The largest declines were in Newfoundland and Labrador (-15.3%) and Saskatchewan (-8.6%). Intellectual property product declined 2.7%in Nova Scotia and 3.5 in Canada for Q3 2020 compared to Q3 2019.
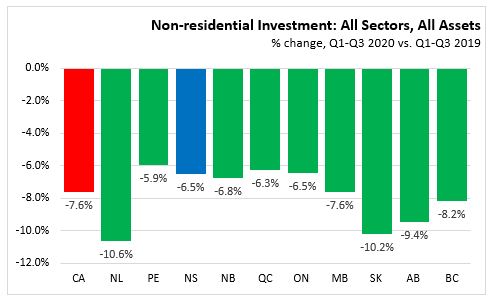
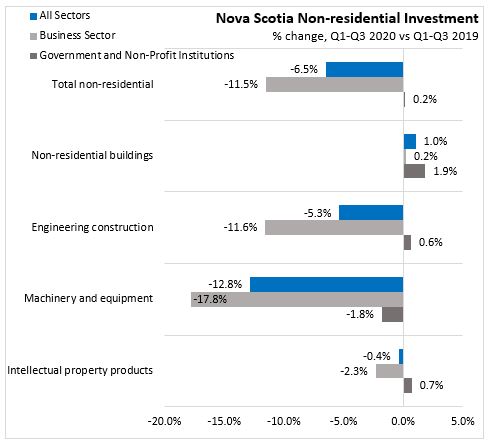
YEAR-TO-DATE (Q1-Q3 2020 vs. Q1-Q3 2019)
Across all sectors and investment types, investment has declined 6.5% in Nova Scotia for the first three quarters of the year. Nationally, non-residential investment decreased 7.6%. The largest declines have been Newfoundland and Labrador (-10.6%), Saskatchewan (-10.2%), and Alberta (-9.4%).
For the first three quarters of 2020, non-residential investment in Nova Scotia has declined 6.5% with a 11.5% decline in the business sector and a 0.2% increase among government and non-profit institutions. The largest contributor to the overall decline (-$293 million) has been in business investments in machinery and equipment (-$239 million) and engineering construction (-$52 million).

Statistics Canada. Table 34-10-0163-01 Flows and stocks of fixed non-residential and residential capital, by sector and asset, provincial and territorial (x 1,000,000)
<--- Return to Archive