The Economics and Statistics Division maintains archives of previous publications for accountability purposes, but makes no updates to keep these documents current with the latest data revisions from Statistics Canada. As a result, information in older documents may not be accurate. Please exercise caution when referring to older documents. For the latest information and historical data, please contact the individual listed to the right.
<--- Return to Archive
For additional information relating to this article, please contact:
December 04, 2020LABOUR MARKET TRENDS - NOVEMBER 2020 LABOUR MARKET TRENDS - NOVEMBER 2020
Labour force survey results reflect the period from November 8 to 14, during which some provinces had introduced new targeted public health measures. While restrictions related to indoor dining and fitness facilities were eased in Ontario in early November, there were new measures affecting restaurants, recreational facilities, and retail businesses in other provinces such as Manitoba and Quebec.
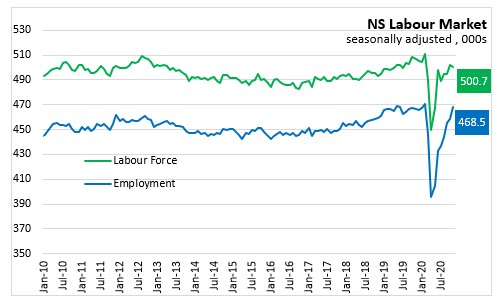
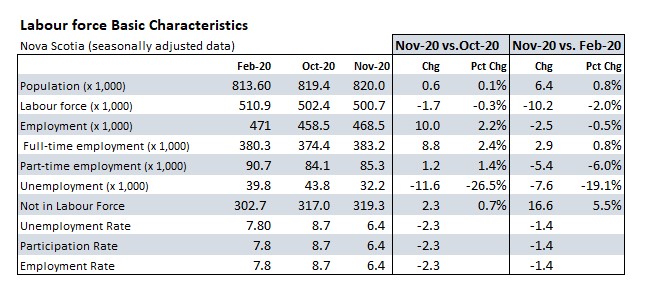
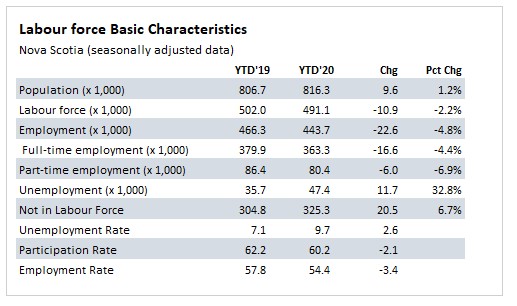
Nova Scotia’s seasonally adjusted employment level was up 10,000 (+2.2%) to 468,500 in November 2020. This was the third highest monthly employment level on record just behind February 2020 (471,000) and May 2019 (468,000).
Nova Scotia’s employment remains 2,500 (0.5%) lower than the pre-COVID levels in February. Nova Scotia has recovered 97% (72,900) of the peak employment loss reported in April (75,400). In comparison, Canada has recovered 81% (2,431 million) of April peak employment losses (-3.004 million).
Nova Scotia’s labour force increased declined 1,700 (-0.3%) to 500,700 in November. The labour force in November is smaller by 10,200 (-2.0%) than February 2020. The number of unemployed persons declined 11,600 compared to October and was down 7,600 compared to February 2020.
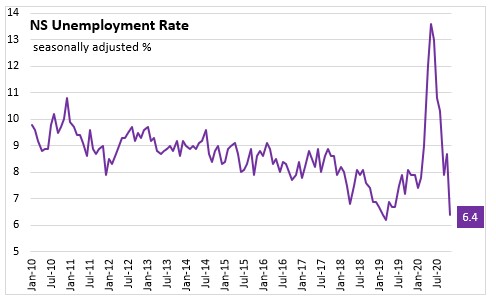
With large gains in employment and a slight decline in the labour force, the unemployment rate declined 2.3 percentage points last month to 6.4% in November 2020. This was the first time in 44 years of the monthly labour force survey data that Nova Scotia has the lowest unemployment rate in Canada.
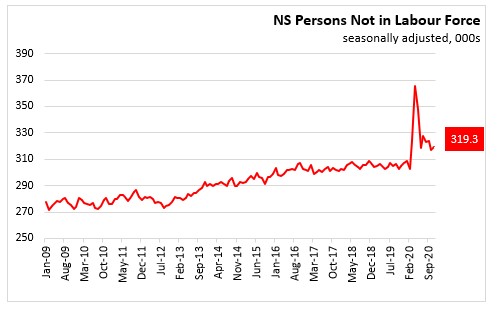
The population not in the labour force increased 2,300 compared to last month. Compared to February 2020, there are an additional 16,600 persons not in the labour force.

In November, full-time employment increased 8,800 (+2.4%) while part-time employment increased 1,200 (+1.45). Full time employment was 383,200 in November – the highest full time employment on record in Nova Scotia. Employment since February 2020 increased by 2,900 (+0.8%) in full-time jobs but declined by 5,400 (-6.0%) in part-time jobs. Changes in the number of hours worked within one job can result in shift employment between part-time and full-time.
The participation rate was down 0.2 percentage points to 61.1% in November and remains 1.7 percentage points below the level observed in February 2020. The employment rate increased 1.1 percentage points to 57.1% and is down 0.8 percentage points compared to the February 2020 level.
Comparing averages for Jan-Nov 2020 with the same period in 2019, Nova Scotia labour force fell 2.2% and employment has been 4.8% lower. The average unemployment rate is 2.6 percentage points higher at 9.7% during the first eleven months of 2020.
In addition to those who have lost employment since February 2020, there are elevated numbers of persons who are counted as employed, but had zero hours (and not for routine reasons like vacation, maternity/parental leave, labour dispute) or had their hours cut by 50% or more. In November 2020 in Nova Scotia there were 27,700 persons employed but at less than 50 per cent of their usual hours (including zero hours), up from 26,700 in October and still elevated by 8,000 compared to 19,700 in February. Combined with those who have lost employment, this amounts to about 2.2% of Nova Scotia’s February 2020 employment level; down from a high of 26.3% in May. The largest total employment/hour impact in November 2020 was in Manitoba (7.6%), Alberta (7.5%), and Newfoundland and Labrador (7.5%). The smallest change was in Nova Scotia (2.2%) and New Brunswick (2.2%).

Statistics Canada reported in supplemental information that Nova Scotia had an increase of 6,400 (Feb-20 to Nov-20) of people who were not in the labour force but wanted to work, rising to 19,600 people. This is down from the 55,500 people in April 2020.
The labour underutilization rate (COVID-19 impact definition) is the proportion of the potential labour force (labour force + those wanting work) that is unemployed, not in labour force but wanted work or employed but have lost the majority of their usual hours.
Labour underutilization have declined from highs during March and April but remain elevated compared to February 2020 in all provinces. In February 2020, Nova Scotia's labour underutilization rate was 13.9%. This underutilization increased to 36.8% in April 2020 and has subsequently fallen to 15.3% in November 2020. The current highest labour underutilization rate is in Newfoundland and Labrador and Alberta (both 20.1% and the lowest rate is in Quebec (14.9%).

Age Cohorts
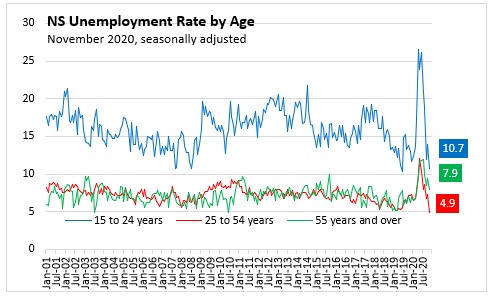
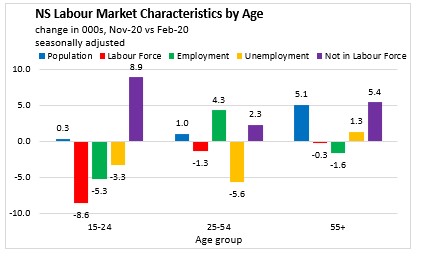
The unemployment rate was down on a monthly basis in November for youth, core-aged and older workers in Nova Scotia. From October to November 2020, unemployment rate decreased 3.2 percentage points to 10.7% for youth workers (ages 15-24), 2.4 percentage points to 4.9% for core-aged workers (ages 25-54) and 1.5 percentage points to 7.9% for older workers (ages 55+). The unemployment rate of 4.9% for core-aged workers is the lowest recorded for Nova Scotia in the Labour Force Survey since its inception in 1976.
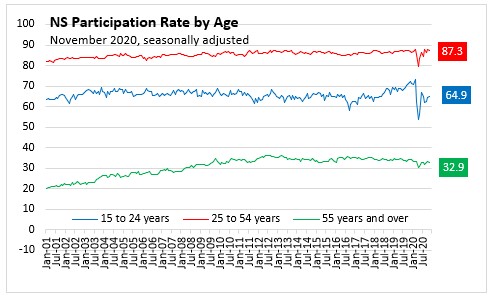
The participation rate for younger Nova Scotians increased 0.3 percentage points to 64.9% in November 2020. For core-aged workers, the participation rate was down 0.4 percentage points to 87.3% while the participation rate for older workers decreased 0.3 percentage points to 32.9% in November.
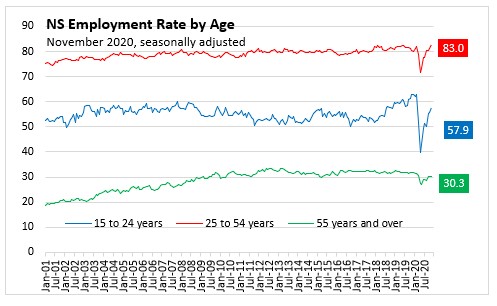
Compared to October 2020, employment rates were up workers of all age groups. Employment rate for youth increased 2.3 percentage points to 57.9% and 1.7 percentage points to 83.0% for core-aged workers. For older workers, the employment rate increased 0.2 percentage points to 30.3%.
Compared with February 2020, employment rates were down for youth (-5.1 percentage points) and older workers (-1.0 percentage points). Core-aged workers employment rate is at a record high of 83.0%, an increase of 0.9 percentage points from February 2020.
Comparing November to February 2020, the decline in employment mostly show up as a decline in the labour force for youth. For core-aged, employment has risen (+4,300) while the labour force has declined (-1,300). For older workers, the decline in employment shows up in increased unemployment instead of a decline in the labour force.
Males and Females
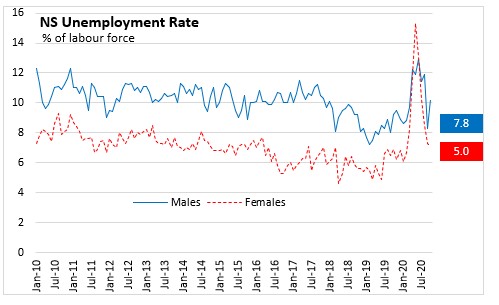
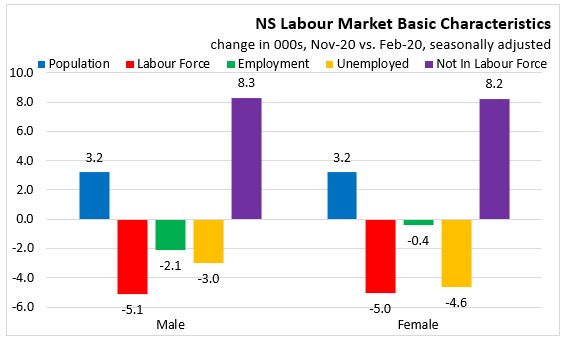
In November, the monthly unemployment rate decreased 2.4 percentage points to 7.8% for males and declined 2.1 percentage points to 5.0% for females.
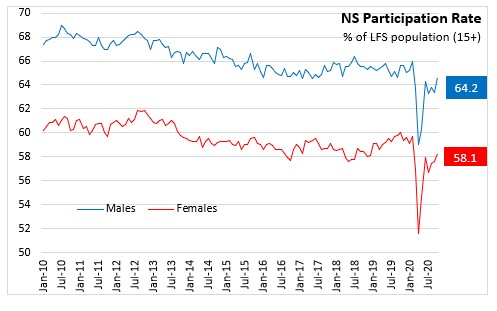
The monthly participation rate was down for both males and females. The participation rate declined 0.4 percentage points to 64.2% for males and 0.2 percentage points to 58.1% for females.
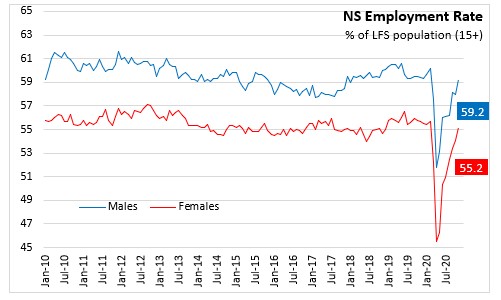
The employment rate was up 1.2 percentage points for males and 1.1 percentage points for females.
Compared with February 2020, male labour force was down 5,100 (-2.0%) in November while female labour force was down 5,000 (-2.0%). Male employment was down 2,100 (-0.9%) while female employment was down 400 (-0.2%). The number of unemployed males was down 3,000 and the number of unemployed females was down 4,600. The male population not in the labour force increased by 8,300 from February to November while the number of females not in the labour force grew by 8,200.
Sectors and Industries
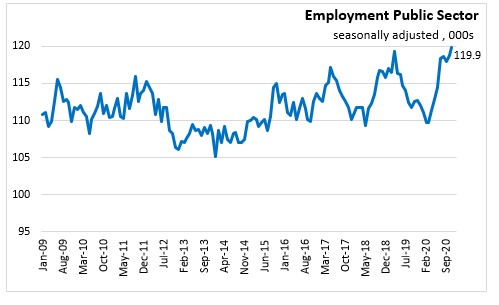
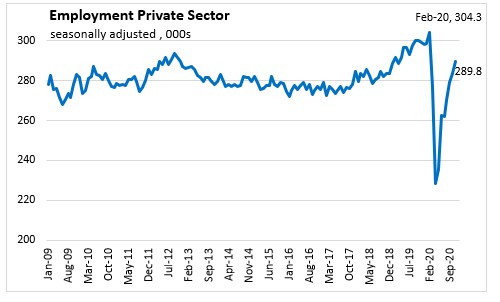
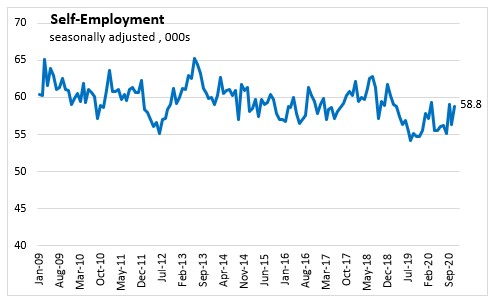
The month employment gains in November were across all classes of workers. Private sector employees increased 6,400 while public sector employees increased 1,100 and self-employed increased 2,500. Compared to February 2020, employment remains lower in the private sector (-14,500) while public sector employees (+10,200) and self-employed (+1,700) is higher.
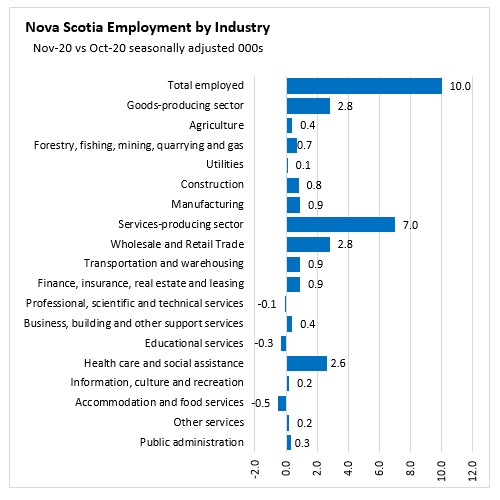
For November, goods-producing sector employment increased (+2,800) with gains in all sub-sectors. The largest gains were recorded in manufacturing (+900), construction (+800) and forestry, fishing, mining and oil and gas (+700).
Service-producing sector employment increased 7,000 in November following a 1,100 increase last month. Monthly employment gains were reported in all sub-sectors except accommodation and food services (-500), educational services (-300) and professional and technical services (-100). Increases occurred in wholesale and retail trade (+2,800) and health care and social assistance (+2.600).
Employment since February 2020 remains 900 lower in goods-producing industries with the lower employment levels in manufacturing (-2,200), forestry, fishing and mining (-1,500) and construction (-100). Agriculture (+2,400) and utilities (+600) have higher employment levels than February 2020.
Service-producing employment is lower by 1,700 since February 2020 with the lower levels in wholesale and retail trade (-7,100), accommodation and food service (-5,000), and information, culture and recreation (-3,000) accounting for the largest number of job losses that have not been recovered.
Employment levels in November 2020 are also lower in transportation and warehousing (-300), and business, building and other support services (-1,300 than February 2020.
Employment levels are higher in November 2020 than February 2020 in educational services (+6,000), professional, scientific, and technical services (+3,500), finance, insurance and real estate (+2,300), public administration (+1,200), other services (+1,000) and health care and social assistance (+900).

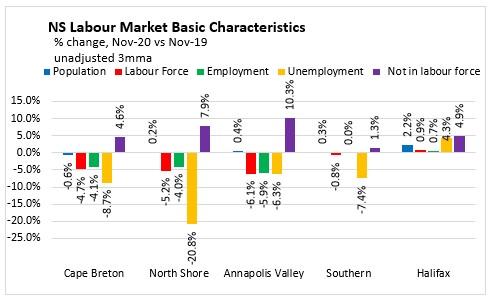
Regions – November 2020 vs November 2019 (unadjusted 3 month moving average)
Compared with November 2019, Cape Breton employment decline by 2,100 while the labour force is down 2,700. The number of unemployed declined 600 and the unemployment rate declined 0.5 percentage points to 11.4%.
For the North Shore region, the labour force declined by 3,900 while employment was down by 2,800. The number of unemployed declined by 1,100 and the unemployment rate has decreased 1.2 percentage points to 5.9%.
The Annapolis Valley reported a decline of 3,800 in the labour force and a decline of 3,500 in employment compared to November 2019 data. Unemployment was up by 200. As a result, the unemployment rate is unchanged at 5.1% compared to November 2019 data. There are 4,200 additional people not in the labour force.
Compared to a year ago, the Southern region experienced a decrease of 400 in labour force and has the same level of employment. The number of unemployed decreased by 400 while the unemployment rate decreased 0.7 percentage points to 9.6%.
In the Halifax region, the labour force recorded an increase of 2,400 while employment has increased 1,600 compared to November 2019. With unemployment increasing 700, the unemployment rate increased 0.2 percentage points to 6.4%. The number of persons not in the labour force increased by 5,800 in Halifax from a year ago.


Provincial Comparisons
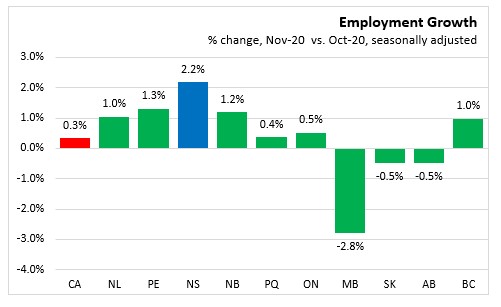
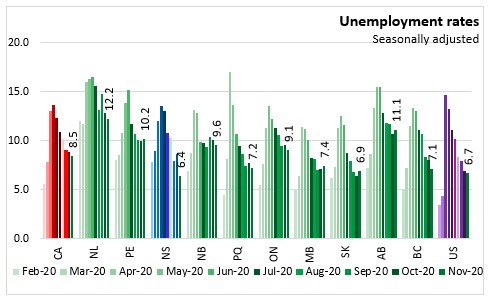
Seven provinces reported increasing employment in November along with declines of 2.8% in Manitoba and 0.5% each in Saskatchewan and Alberta. Nova Scotia (+2.2%) posted the highest monthly gain across provinces. Employment increased 0.3% month-over-month in Canada.
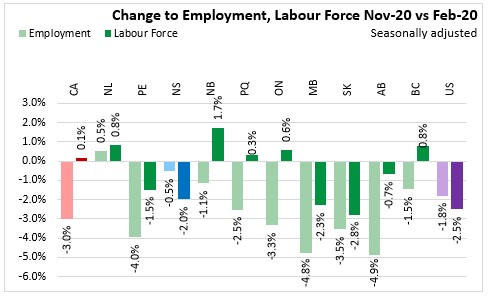
Compared to February 2020, the labour force remains lower only in five provinces while nationally it has recovered (+0.1%). The largest decline in the labour force since February 2020 has been in Saskatchewan (-2.8%).
All provinces except Newfoundland and Labrador report lower employment in November than February. The largest employment declines since February is in Alberta (-4.9%) and Manitoba (-4.8%). Employment was up 0.5% in Newfoundland and Labrador.
Unemployment rates declined in six provinces in November 2020, increasing in the other four provinces. The highest unemployment rate for October 2020 is in Newfoundland and Labrador at 12.2% and the lowest is in Nova Scotia at 6.4%. Canada’s unemployment rate was 8.5% in November 2020.
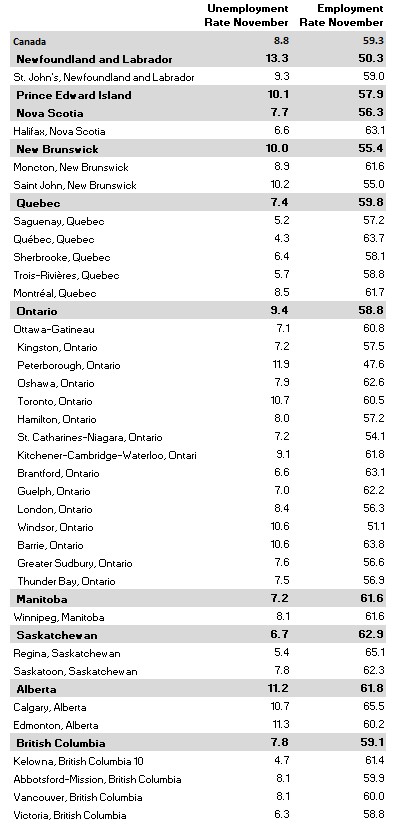
National Comparisons: Cities (Monthly, 3 month moving average)
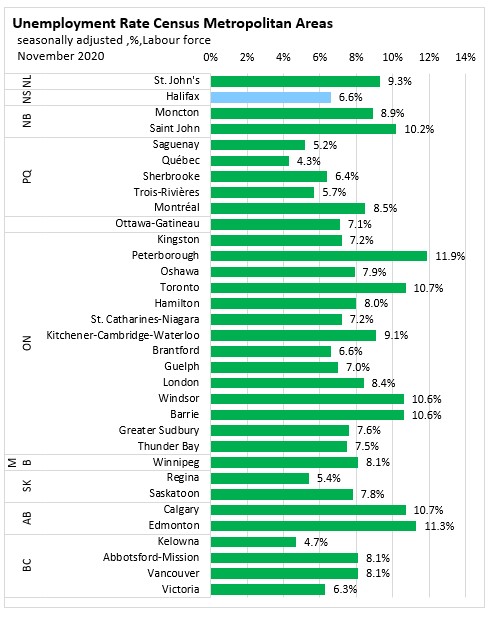
The unemployment rate for Halifax Census Metropolitan Area (CMA) in November 2020 was 6.6% (seasonally adjusted 3 month moving average). Quebec City at 4.3% had the lowest unemployment rate among CMAs while the highest was in Peterborough (11.9%).
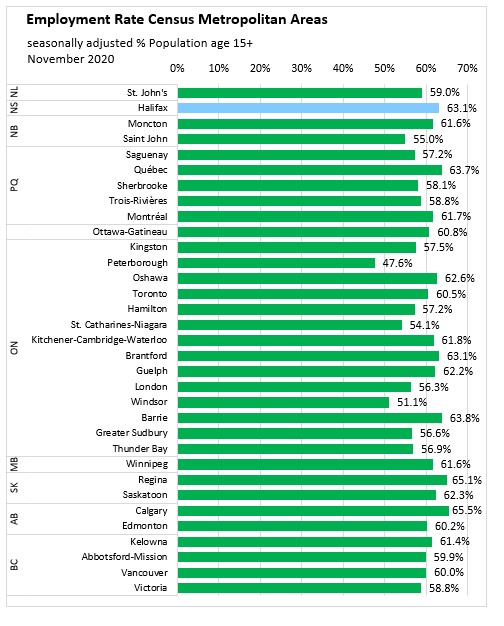
The seasonally adjusted employment rate for Halifax was 63.1%, up 0.6 percentage points compared to last month. Peterborough, Ontario (47.6%) had the lowest employment rate, while Calgary (65.5%) the highest.
Halifax’s employment (3 month moving average) for November 2020 was up 1.1 % compared to the October 2020 result. The employment level (Sept-Nov) average compared to Aug-Oct average was up in most CMAs this month with the largest increase in Kelowna (3.5%).
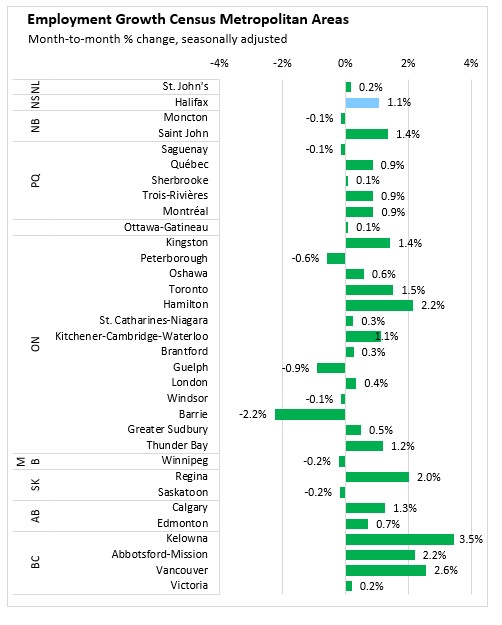
Note: Seasonally adjusted, 3 month average.
Sources:
Statistics Canada. Table 14-10-0287-01 Labour force characteristics, monthly, seasonally adjusted and trend-cycle, last 5 months
Statistics Canada. Table 14-10-0294-01 Labour force characteristics by census metropolitan area, three-month moving average, seasonally adjusted and unadjusted, last 5 months
Statistics Canada. Table 14-10-0293-01 Labour force characteristics by economic region, three-month moving average, unadjusted for seasonality, last 5 months
Statistics Canada. Table 14-10-0355-01 Employment by industry, monthly, seasonally adjusted and unadjusted, and trend-cycle, last 5 months (x 1,000)
Statistics Canada. Table 14-10-0288-01 Employment by class of worker, monthly, seasonally adjusted and unadjusted, last 5 months (x 1,000)
<--- Return to Archive