The Economics and Statistics Division maintains archives of previous publications for accountability purposes, but makes no updates to keep these documents current with the latest data revisions from Statistics Canada. As a result, information in older documents may not be accurate. Please exercise caution when referring to older documents. For the latest information and historical data, please contact the individual listed to the right.
<--- Return to Archive
For additional information relating to this article, please contact:
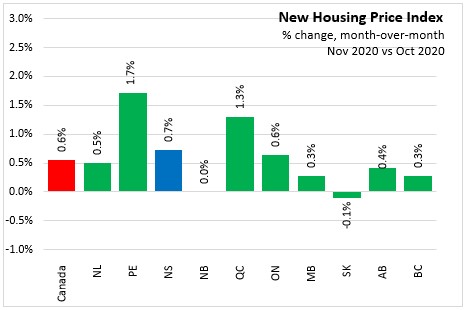
December 21, 2020NEW HOUSING PRICE INDEX, NOVEMBER 2020 New housing prices in Nova Scotia increased 0.7% month-over-month in November 2020.
Nationally, new home prices were up 0.6% month-over-month in November following a 0.8% gain in October. Across Canada, new home prices increased 3.7% since the start of the COVID-19 pandemic in March. In contrast, there was no change in the average new home prices from March to November, 2019.
In today's release, Statistics Canada noted the shift in buyers' demand towards single-family homes, mostly due to more Canadians working from home during the pandemic. Detached homes have been the preferred choice for 70% of new home buyers in 2020.
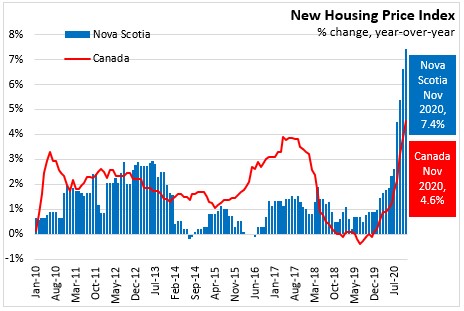
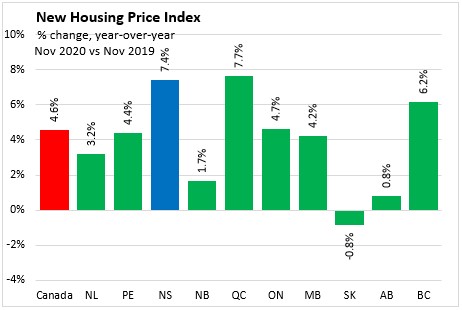
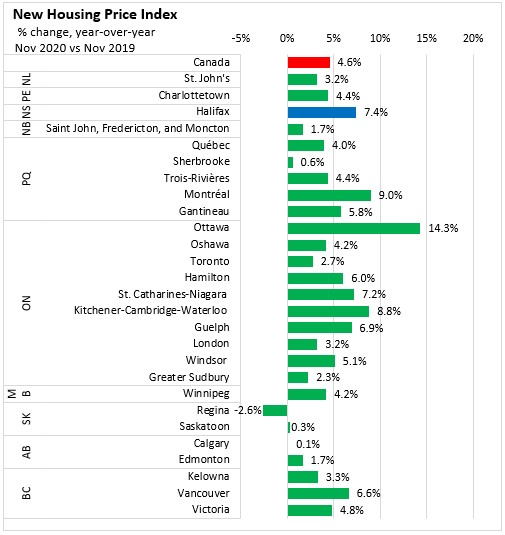
New housing prices in Nova Scotia increased 7.4% year-over-year in November, posting the second largest annual growth across provinces behind Quebec (+7.7%). This was the fastest year-over-year growth in Nova Scotia since April 2008.
In Canada, new housing prices increased 4.6% year-over-year in November, the largest annual growth since April 2008. Compared to November 2019, new housing prices were only down in Saskatchewan (-0.8%).
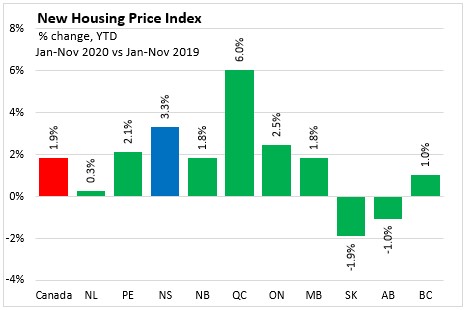
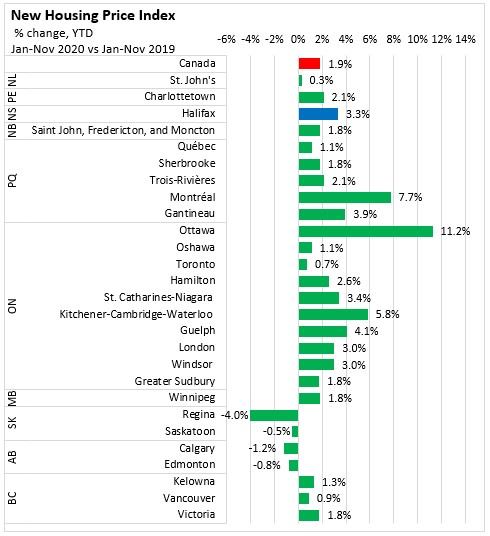
Comparing Jan-Nov 2020 to Jan-Nov 2019, new home prices in Nova Scotia are up 3.3%. National home prices were up 1.9% during the same period. Quebec recorded the largest increase at 6.0% while Saskatchewan experienced the largest decline at -1.9%.
Census Metropolitan Areas
Year-over-year, new home prices increased in the majority of Census Metropolitan Areas in November except for Regina. The fastest growth was recorded in Ottawa (+14.3%) and Montreal (+9.0%). New home prices accelerated in Kitchener-Cambridge-Waterloo (+8.8%) and Guelph (+6.9%), with higher housing demand due to growth in the technology sector in both cities attracting more skilled workers.
Year-to-date (Jan-Nov 2020 vs. Jan-Nov 2019), new home prices in Halifax increased 3.3%. Across Census Metropolitan Areas, the largest growth was recorded in Ottawa (+11.2%) and Montreal (+7.7%). New home prices were down in Regina (-4.0%), Calgary (-1.2%), Edmonton (-0.8%) and Saskatoon (-0.5%).
Statistics Canada Note: With the release of the January 2017 NHPI data, a number of important changes have been introduced to increase the relevance of the index series. The index base period, for which the NHPI equals 100, is now December 2016. The NHPI basket has been updated with new weights for the 2017 series, its coverage has been expanded to include new CMAs.
Source Statistics Canada. Table 18-10-0205-01 New housing price index, monthly
<--- Return to Archive