The Economics and Statistics Division maintains archives of previous publications for accountability purposes, but makes no updates to keep these documents current with the latest data revisions from Statistics Canada. As a result, information in older documents may not be accurate. Please exercise caution when referring to older documents. For the latest information and historical data, please contact the individual listed to the right.
<--- Return to Archive
For additional information relating to this article, please contact:
January 04, 2021SURVEY OF FINANCIAL SECURITY, 2019 Statistics Canada has updated the Survey of Financial Security to 2019, providing estimates of household assets, debts and net worth for Canada and the Provinces.
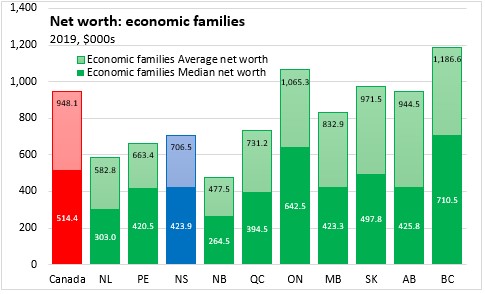
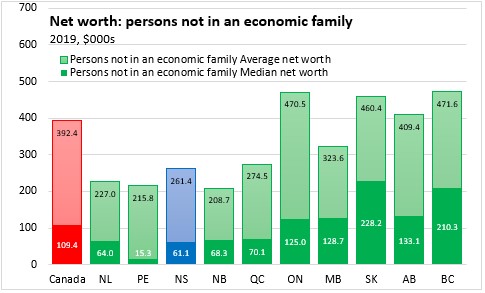
Average household net worth (assets less financial debts) was $948,100 for economic families in Canada; median net worth (not skewed by higher values) was $514,400 for economic families in 2019. Values for persons not in an economic family are lower: an average net worth of $392,400 and a median net worth of $109,400. Medians and averages reported here are among those who report having debt or assets.
Nova Scotia's net worth of economic families averaged $706,500 in 2019 with a median value of $423,900. For persons not in an economic family, Nova Scotia reported average net worth of $261,400 with a median of $61,100.
Across Canada, net worth is lower in Atlantic Canada and Quebec while there are higher values in Ontario and western Canada. The highest values of average net worth were reported in Ontario and British Columbia.
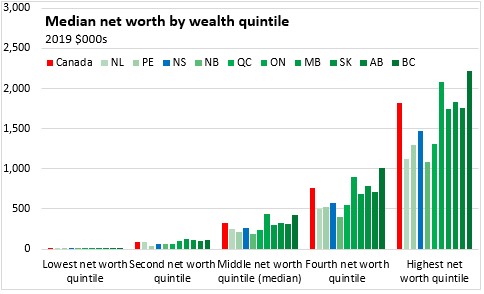
The Survey of Financial Security allows comparison of net worth by quintiles of net worth as well as by quintiles of income and by age cohort. These quintiles includes economic families as well as those not in economic families.
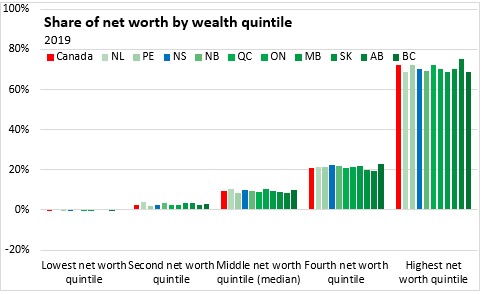
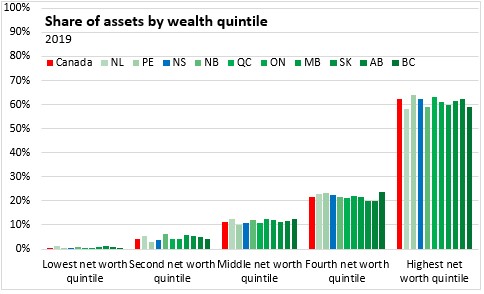
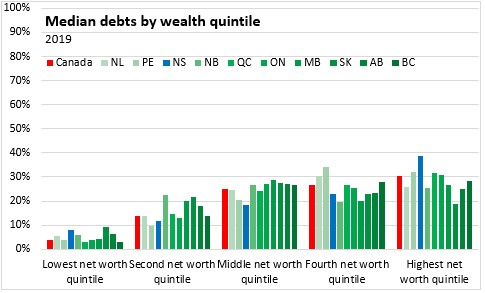
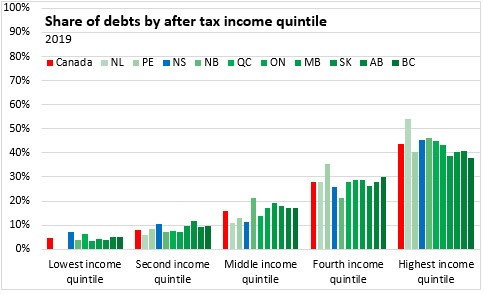
Those in the highest quintile by net worth in Canada (ie: those 20% of the population that have the highest net worth) have a median net worth of $1.81 million and account for 72.0% of the net worth in Canada. In Nova Scotia, the highest quintile by net worth had median net worth of $1.48 million, accounting for 70.4% of the total net worth of Nova Scotians. Those in the highest net worth quintile have substantially larger median assets than those in other quintiles, but the debts of those in the highest net worth quintile are not substantially larger. Nova Scotians in the highest net worth quintile owe a larger portion of debts than their counterparts in other provinces.
Nova Scotia households in lower quintiles had lower median net worth than comparable national quintiles. The first two quintiles of net worth reported 2.3% of total net worth in the province - slightly below the national average (those in the lowest quintile can report negative net worth).


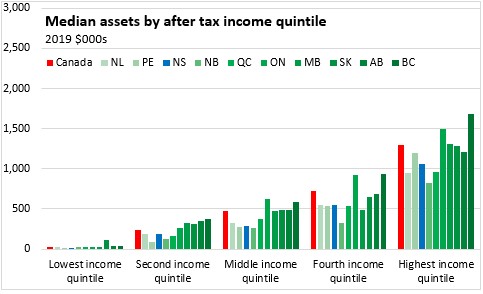
The population's net worth can also be divided into income quintiles as income and net worth are not necessarily coincident. The highest earning 20% of Canadians had a median net worth of $1.02 million; the highest earning quintile had median net worth of $0.90 million in Nova Scotia. Median net worth of the lowest earning quintile in Nova Scotia was closer to the national average, while those in the second, third and fourth income quintiles had lower median net worth in Nova Scotia than the national average.
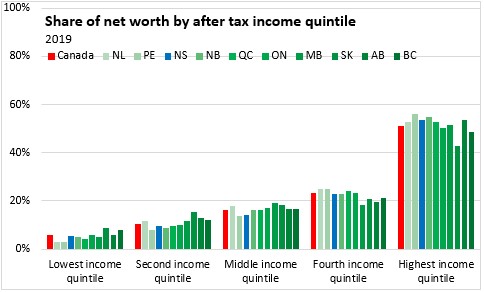
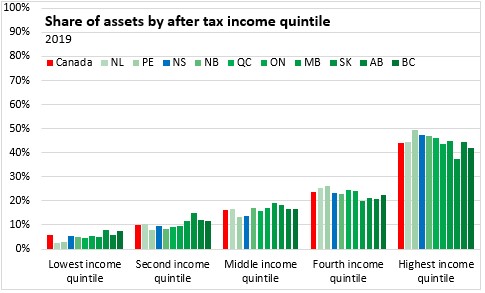
Those with higher income have a greater share of net worth in every province, but the gap between the highest income quintile and other income quintiles (in either net worth or assets) is smaller than the gap in net worth for those in the highest net worth quintile over those in lower net worth quintiles.
The highest earning income quintiles account for 51.2% of household net worth in Canada. Nova Scotia's highest earning quintile had 53.7% of the province's net worth.


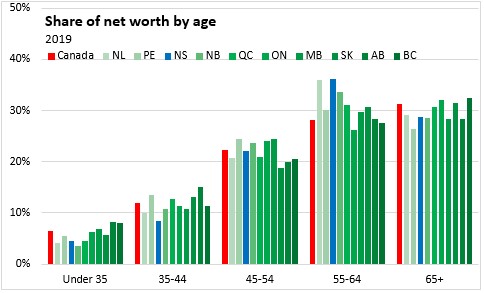
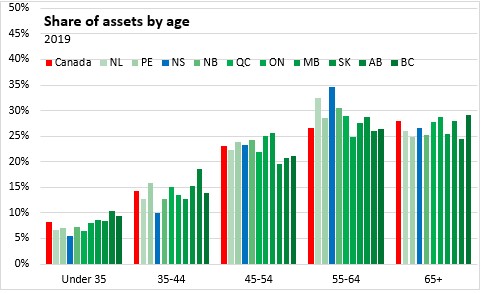
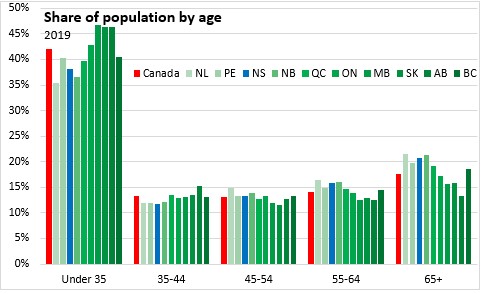
As assets accumulate and debts are repaid over time, the net worth of households rises, particularly for those aged 35-44 and 45-54. Those in the 55-64 age cohort report the highest median net worth. Older cohorts (who are drawing down on assets in retirement) see their net worth decline - both debts and assets are lower for older age cohorts.
As a percentage of total net worth, households in the 65+ and 55-64 cohorts have the highest share of net worth. In Nova Scotia's case, an older demographic profile results in a larger concentration of net worth in older age cohorts - either when compared with younger cohorts in the province or similar cohorts at the national level.


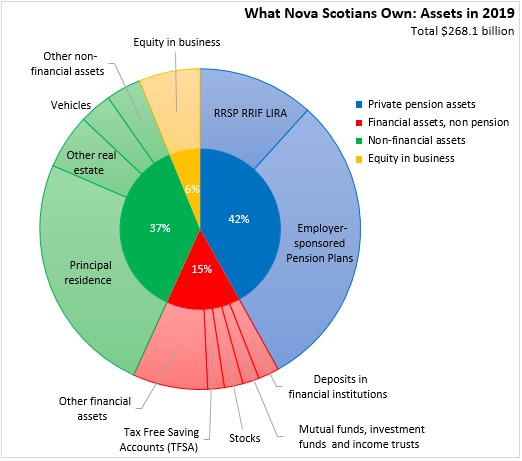
The Survey of Financial Security provides a breakdown of the total assets and liabilities of Nova Scotians. The province's total net worth of $237.4 billion consists of assets of $268.1 billion offset by debts of $30.7 billion.
Of the total assets, 42% are in pension-related assets. A further 15% of Nova Scotians' assets are held in non-pension financial assets, with deposits and mutual funds as the largest categories. The largest non-financial asset for Nova Scotians is real estate. Equity in businesses accounts for 6% of Nova Scotians asssets.
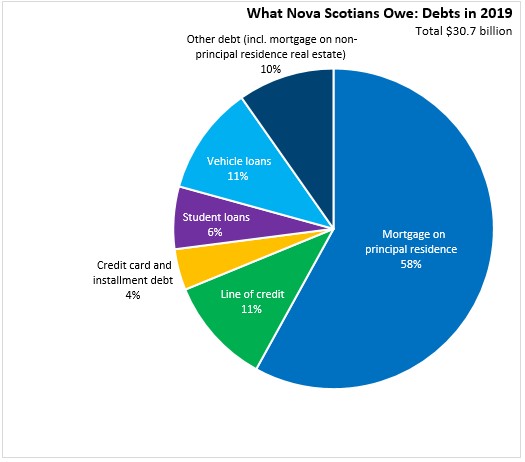
Nova Scotians owed a total of $30.7 billion in debts in 2019. Mortgages on principle residence were the largest portion of Nova Scotians debt, accounting for 58% of total debt.
Compared with national median values by asset category (among those who hold each type of asset), Nova Scotians have more pension assets, stocks, and business equiyty but lower than national median amounts in other financial asset categories. The value of Nova Scotians' non-financial assets are also lower than the Canadian median, particularly in comparison with higher real estate values in Ontario, Alberta and British Columbia.

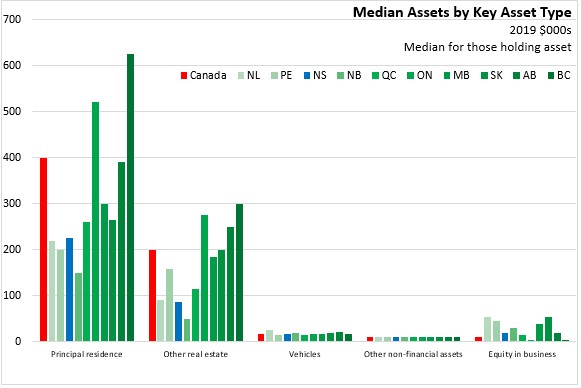
In comparison with other provinces, Nova Scotians have lower real estate mortgage debt (non-principle residence mortgage median is unavailable for Nova Scotia), but higher median values for vehicle loans, lines of credit, but higher student debt.

Statistics Canada. Table 11-10-0016-01 Assets and debts held by economic family type, by age group, Canada, provinces and selected census metropolitan areas, Survey of Financial Security (x 1,000,000); Table 11-10-0049-01 Assets and debts by net worth quintile, Canada, provinces and selected census metropolitan areas, Survey of Financial Security (x 1,000,000); Table 11-10-0057-01 Assets and debts by after-tax income quintile, Canada, provinces and selected census metropolitan areas, Survey of Financial Security (x 1,000,000); Table 17-10-0005-01 Population estimates on July 1st, by age and sex
<--- Return to Archive