The Economics and Statistics Division maintains archives of previous publications for accountability purposes, but makes no updates to keep these documents current with the latest data revisions from Statistics Canada. As a result, information in older documents may not be accurate. Please exercise caution when referring to older documents. For the latest information and historical data, please contact the individual listed to the right.
<--- Return to Archive
For additional information relating to this article, please contact:
January 05, 2021AQUACULTURE STATISTICS, 2019 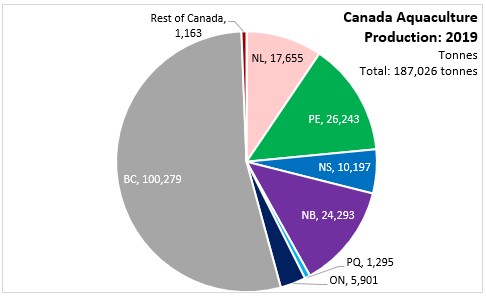
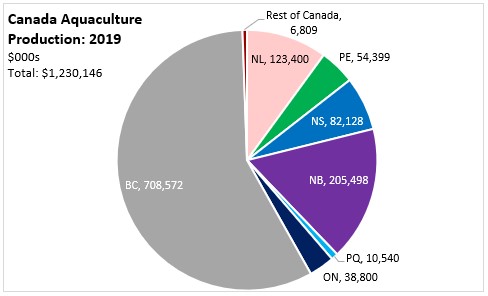
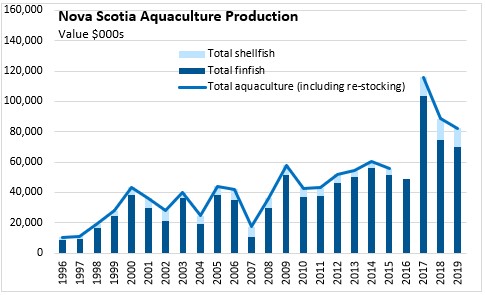
Canada's aquaculture industry produced 187,026 tonnes of finfish and shellfish products in 2019 (including restocking), with a value of $1.23 billion. By province, Canada's largest aquaculture producers are British Columbia and New Brunswick, which account for two thirds of production volume and nearly three quarters of production value. Nova Scotia's aquaculture industry produced 10,197 tonnes of output in 2019 with a value of $82.1 million.
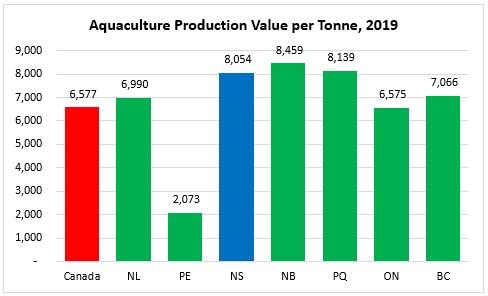
In 2019, the average unit value of Nova Scotia's aquaculture products was above the national average at $8,054 per tonne. New Brunswick aquaculture had the highest value per tonne while Prince Edward Island had the lowest. This differences across provinces reflects in part differences in the relative amounts of finfish and shellfish produced in each province, with finfish generally having higher unit values.
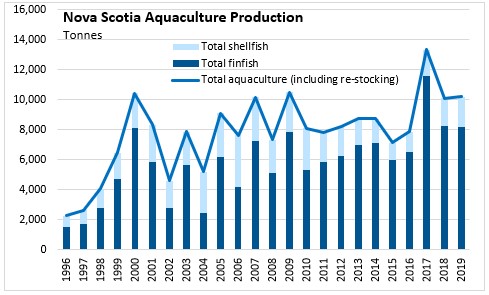
Nova Scotia's aquaculture output volume was up in 2019 following a larger decline in 2018. Compared with 2007, Nova Scotia's aquaculture production is little changed in volume terms. The value of Nova Scotia’s aquaculture production declined for the second straight year, dropping 7.3% from 2018 to 2019. Since 2007, the value of output has grown at an average rate of 13.8% per year.
Value Added
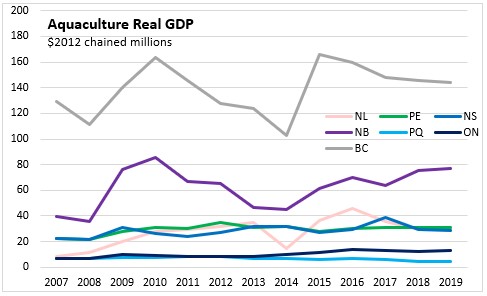
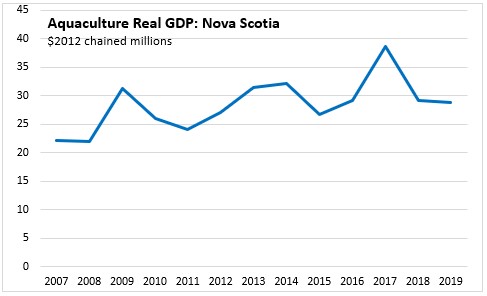
After at 32.6% rise in 2017, the value of real GDP in Nova Scotia's aquaculture industry declined 24.6% in 2018 and 1.0% in 2019. British Columbia and New Brunswick generate the largest amount of real GDP from aquaculture, followed by similar output from Nova Scotia, Newfoundland and Labrador and Prince Edward Island.
Since 2007, Nova Scotia's real GDP from aquaculture has grown at an average rate of 2.2% per year. The fastest growth in real GDP from aquaculture over this time was observed in Newfoundland and Labrador (+10.6%), followed by Ontario (+6.0%) and New Brunswick (+5.8%).
Source: Statistics Canada. Table 32-10-0107-01 Aquaculture, production and value; Table 36-10-0402-01 Gross domestic product (GDP) at basic prices, by industry, provinces and territories (x 1,000,000)
<--- Return to Archive