The Economics and Statistics Division maintains archives of previous publications for accountability purposes, but makes no updates to keep these documents current with the latest data revisions from Statistics Canada. As a result, information in older documents may not be accurate. Please exercise caution when referring to older documents. For the latest information and historical data, please contact the individual listed to the right.
<--- Return to Archive
For additional information relating to this article, please contact:
January 15, 2021US RETAIL SALES, DECEMBER AND ANNUAL 2020 The US Census Bureau announced today estimates of seasonally-adjusted U.S retail and food service sales for December 2020. Retail sales and food services increased 2.6% (+$13.8 billion) over November 2020 to $543.4 billion. Retail sales alone increased by 5.4% to $489.0 billion, while food service and drinking place receipts decreased 17.0% to $54.4 billion.
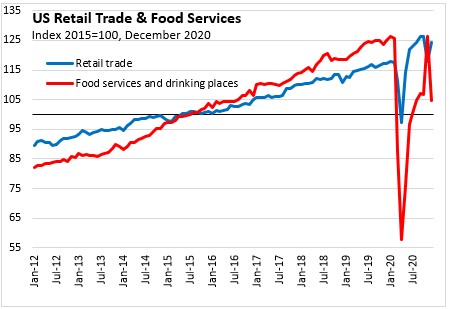
Year-over year, retail trade and food services increased 3.4% over December 2019. Retail trade increased 6.1% and food services and drinking places sales decreased 16.2% compared to the same month a year ago.
Compared to February 2020, retail trade and food service sales were up 3.1% in December. Retail trade was 5.9% higher in December versus February, while food services and drinking places sales were down 16.8%
Annual 2020
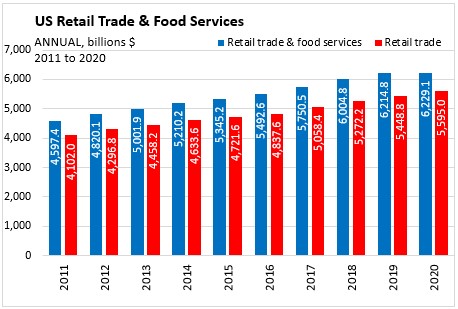
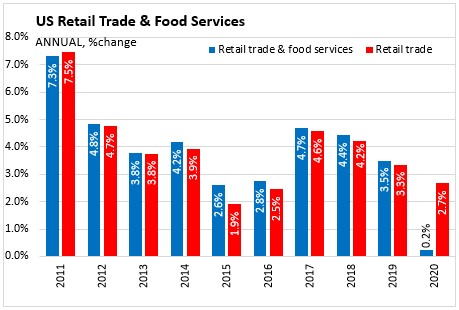
Retail sales and food service receipts were up 0.2% in 2020. Excluding food services and drinking places, retail trade sales were up 2.7% (+$146.3 billion). Food service and drinking places receipts were down 17.2% (-$131.9 billion).

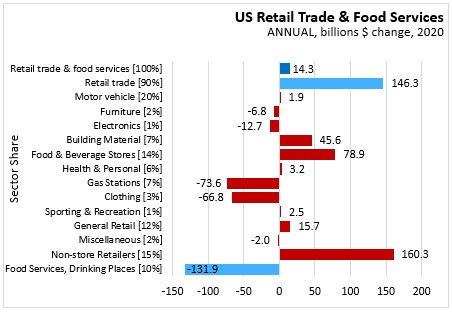
In percentage terms, sales were up in 7 of 13 retail categories, the fastest gains being reported in Non-store Retailers (+20.2%). The largest declines (in percentage terms) were seen in Clothing Stores (-25.0%).
Retail Trade increased 2.7% ($146.3 billion) to $5,595 billion.
- Motor vehicle dealers increased 0.2% ($1.9 billion).
- Furniture stores decreased 5.7% ($6.8 billion).
- Electronics stores decreased 13.1% ($12.7 billion).
- Building materials stores increased 11.9% ($45.6 billion).
- Food and beverage stores increased 10.3% ($78.9 billion).
- Heath and personal care stores increased 0.9% ($3.2 billion).
- Gasoline Stations decreased 14.7% ($73.6 billion).
- Clothing stores decreased 25.0% ($66.8 billion).
- Sports and hobby stores increased 3.1% ($2.5 billion).
- General merchandise stores increased 2.2% ($15.7 billion).
- Miscellaneous retail decreased 1.5% ($2.0 billion).
- Non-store retailers increased 20.2% ($160.3 billion).
- Food services and drinking places decreased 17.2% ($131.9 billion).
Source: US Census Bureau, Data Tables
<--- Return to Archive