The Economics and Statistics Division maintains archives of previous publications for accountability purposes, but makes no updates to keep these documents current with the latest data revisions from Statistics Canada. As a result, information in older documents may not be accurate. Please exercise caution when referring to older documents. For the latest information and historical data, please contact the individual listed to the right.
<--- Return to Archive
For additional information relating to this article, please contact:
January 15, 2021UK TRADE BALANCE, NOVEMBER 2020
UK TRADE BALANCE
Month-over-month (Nov 2020 vs Oct 2020, seasonally adjusted)
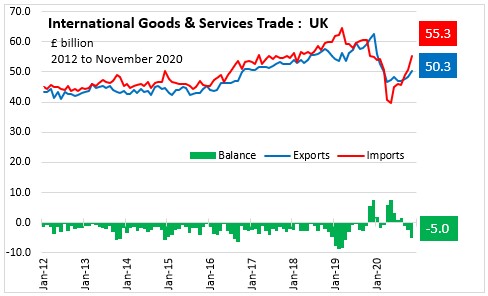
The United Kingdom Goods and services balance of trade deficit widened by £2.7 billion to £5.0 billion.
- exports of goods and services increased 3.9% (£1.9 billion) to £50.3 billion.
- imports of goods and services increased 8.9% (£4.5 billion) to £55.3 billion.
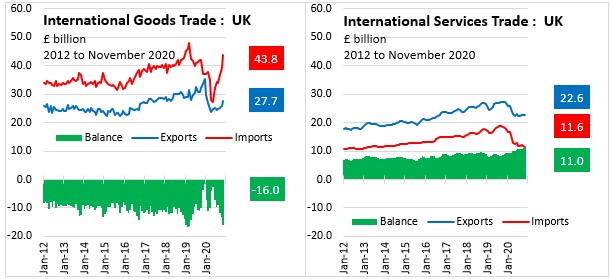
The United Kingdom Goods balance of trade deficit widened by £2.7 billion to £16.0 billion.
- exports of goods increased 7.5% (£1.9 billion) to £27.7 billion.
- imports of goods increased 11.9% (£4.7 billion) to £43.8 billion.
The United Kingdom Services balance of trade surplus widened by £0.1 billion to £11.0 billion.
- exports of services decreased 0.3% (£0.1 billion) to £22.6 billion.
- imports of services decreased 1.1% (£0.1 billion) to £11.6 billion.
Year-over-year (Nov 2020 vs Nov 2019, seasonally adjusted)
The United Kingdom Goods and services balance of trade deficit changed from a surplus (£5.5 billion) to a deficit (£5.0 billion).
- Goods balance of trade deficit widened by £12.4 billion.
- Services balance of trade surplus widened by £1.9 billion.
TRADING PARTNERS
Month-over-month (Nov 2020 vs Oct 2020, seasonally adjusted)
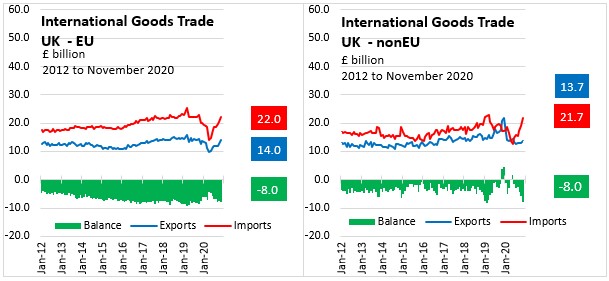
The United Kingdom EU-UK Goods balance of trade deficit widened by £0.5 billion to £8.0 billion.
- exports of goods increased 9.5% (£1.2 billion) to £14.0 billion.
- imports of goods increased 8.6% (£1.7 billion) to £22.0 billion.
The United Kingdom non-EU-UK Goods balance of trade deficit widened by £2.2 billion to £8.0 billion.
- exports of goods increased 5.5% (£0.7 billion) to £13.7 billion.
- imports of goods increased 15.5% (£2.9 billion) to £21.7 billion.
Year-over-year (Nov 2020 vs Nov 2019, seasonally adjusted)
The United Kingdom
- EU-UK Goods balance of trade deficit widened by £0.6 billion.
- non-EU-UK Goods balance of trade deficit widened by £11.9 billion as good exports decreased £7.2 billion and imports increased £4.7 billion.
GOODS TRADE BY SECTOR
Year-to-date (Jan-Nov 2020 ) Goods Trade by Sector
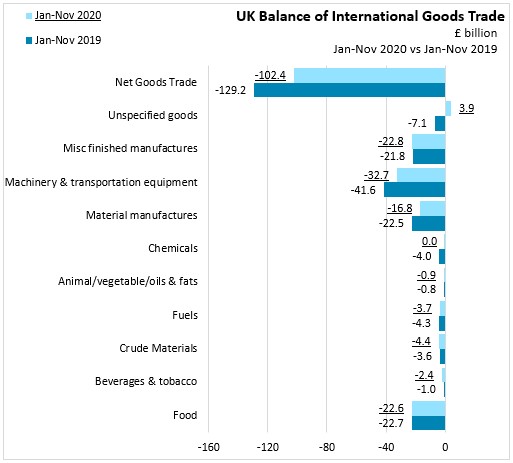
NET TRADE
The Total trade deficit narrowed by £26.8 billion to £102.4 billion.
- Food deficit narrowed by £136.0 million to £22.6 billion.
- Beverages & tobacco deficit widened by £1463.0 million to £2.4 billion.
- Crude Materials deficit widened by £866.0 million to £4.4 billion.
- Fuels deficit narrowed by £577.0 million to £3.7 billion.
- Animal/vegetable/oils & fats deficit widened by £75.0 million to £0.9 billion.
- Chemicals deficit narrowed by £3912.0 million to £0.5 billion.
- Material manufactures deficit narrowed by £5,704.0 million to £16.8 billion.
- Machinery & transport equip deficit narrowed by £8,944.0 million to £32.7 billion.
- Misc finished manufactures deficit widened by £1,059.0 million to £22.8 billion.
- Unspecified goods changed from a deficit to a surplus (£3.9 billion).
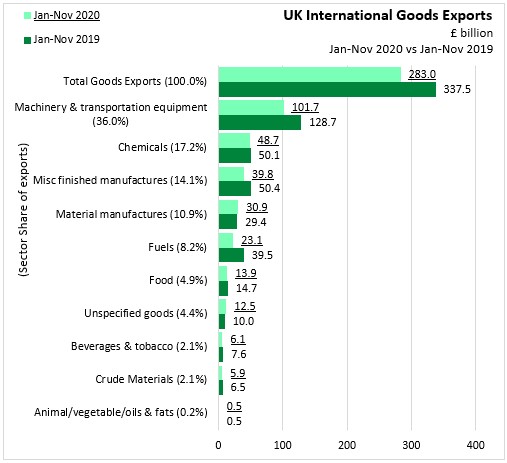
EXPORTS
Total Goods Exports decreased £54,471 millions to £283.0 billions.
- Machinery & transportation equipment decreased £26,956 millions to £101.7 billions.
- Chemicals decreased £1,426 millions to £48.7 billions.
- Misc finished manufactures decreased £10,670 millions to £39.8 billions.
- Material manufactures increased £1,567 millions to £30.9 billions.
- Fuels decreased £16,387 millions to £23.1 billions.
- Food decreased £880 millions to £13.9 billions.
- Unspecified goods increased £2,424 millions to £12.5 billions.
- Beverages & tobacco decreased £1,553 millions to £6.1 billions.
- Crude Materials decreased £584 millions to £5.9 billions.
- Animal/vegetable/oils & fats decreased £6 millions to £0.5 billions.
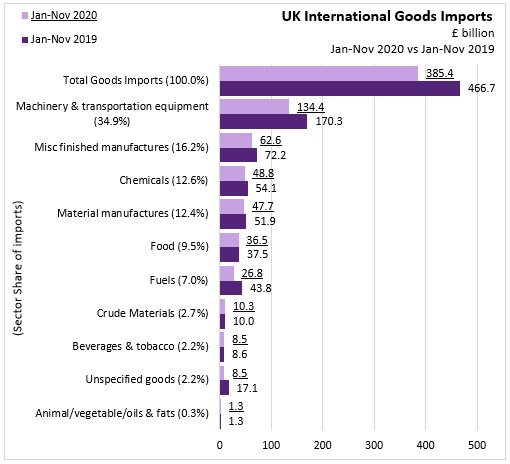
IMPORTS
Total Goods Imports decreased £81,297 millions to £385.4 billions.
- Machinery & transportation equipment decreased £35,900 millions to £134.4 billions.
- Misc finished manufactures decreased £9,611 millions to £62.6 billions.
- Chemicals decreased £5,338 millions to £48.8 billions.
- Material manufactures decreased £4,137 millions to £47.7 billions.
- Food decreased £1,016 millions to £36.5 billions.
- Fuels decreased £16,964 millions to £26.8 billions.
- Crude Materials increased £282 millions to £10.3 billions.
- Beverages & tobacco decreased £90 millions to £8.5 billions.
- Unspecified goods decreased £8,592 millions to £8.5 billions.
- Animal/vegetable/oils & fats increased £69 millions to £1.3 billions.
Source: UK Office for National Statistics, Statistical Bulletin | Time Series | Time Series Explorer
<--- Return to Archive