The Economics and Statistics Division maintains archives of previous publications for accountability purposes, but makes no updates to keep these documents current with the latest data revisions from Statistics Canada. As a result, information in older documents may not be accurate. Please exercise caution when referring to older documents. For the latest information and historical data, please contact the individual listed to the right.
<--- Return to Archive
For additional information relating to this article, please contact:
January 18, 2021NOVA SCOTIA INTERNATIONAL TRADE 2019 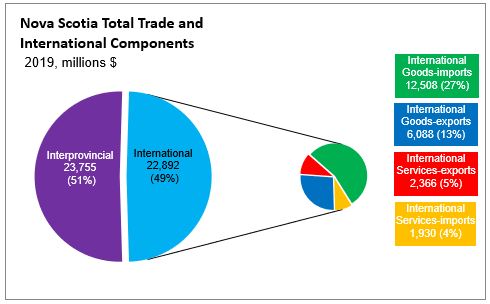
YEAR OVER YEAR (2019 vs 2018)
The trade data in the economic accounts represent provincial total and net expenditures in interprovincial and international markets. As there are important differences in the characteristics of international and interprovincial markets, it is useful to provide a separate analysis. In this note, the focus is on international trade.
Several components of international trade are considered separately and in combination. These include exports, imports, goods, services, total and net trade. Net trade is particularly important as it represents deferred expenditures, either in the form of domestic savings (surplus) or domestic borrowing (deficit).
Total international trade is the sum of international imports and exports, and international goods and services. It is the measure of total international trade activity external to the provincial domestic market and interprovincial markets.
Total international trade is comprised of four components.
In order by value, they are:
- international goods-imports ($12.508 billion),
- international goods-exports ($6.088 billion),
- international services-exports ($2.366 billion) and
- international services-imports ($1.930 billion).
- Summed, gross trade = $22.892 billion.
By commodity category:
- international gross goods valued at $18.6 billion (81.2% share)
- international gross services valued at $4.3 billion (18.8% share).
By market category:
- international total imports valued at $14.438 billion (63.1% share)
- international total exports valued at $8.454 billion (36.9% share)
- The result: Nova Scotia's international net trade is a $5.984 billion DEFICIT.
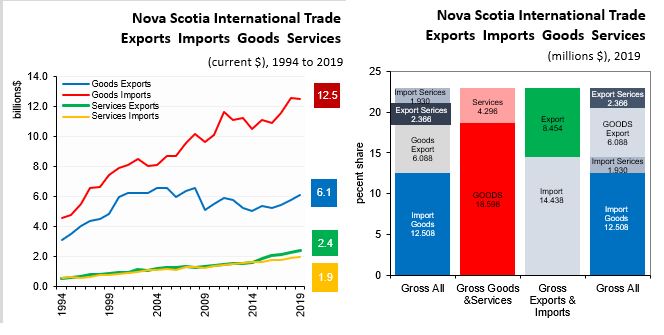
INTERNATIONAL TRADE GROWTH
Ranking the components of trade and nominal GDP by year-over-year percentage growth yields the following:
- The value of international Exports of Goods to other countries increased 5.3% to $6.1 billion.
- International Exports of Services to other countries increased 4.0% to $2.4 billion.
- GDP increased 3.3% to $44.4 billion.
- International Imports of Services from other countries increased 2.9% to $1.9 billion.
- International Imports of Goods from other countries decreased -0.5% to $12.5 billion.
The two components of international trade increased faster than nominal GDP on a year-over-year basis. Nova Scotia international trade, it can be said EXPANDED with international exports of goods and international exports of services trade, and CONTRACTED with international imports of goods and internation imports of goods trade.
Long run growth
In Nova Scotia 2010 to 2019, ranking the components of International trade and nominal GDP by percentage growth over the period yields the following:
- International Exports of Services to other countries increased 72.8% (CAGR=6.5%).
- International Imports of Services from other countries increased 38.7% (CAGR=3.9%).
- GDP increased 26.7% (CAGR=2.3%).
- International Imports of Goods from other countries increased 24.1% (CAGR=1.0%).
- International Exports of Goods to other countries increased 10.3% (CAGR=0.5%).
Nova Scotia international trade, it can be said EXPANDED with long run international exports of services and international imports of services trade, and CONTRACTED with international imports of goods and international exports of goods
Statistics Canada Tables 36-10-0222-01
<--- Return to Archive