The Economics and Statistics Division maintains archives of previous publications for accountability purposes, but makes no updates to keep these documents current with the latest data revisions from Statistics Canada. As a result, information in older documents may not be accurate. Please exercise caution when referring to older documents. For the latest information and historical data, please contact the individual listed to the right.
<--- Return to Archive
For additional information relating to this article, please contact:
January 22, 2021FOOD SERVICES AND DRINKING PLACES, NOVEMBER 2020 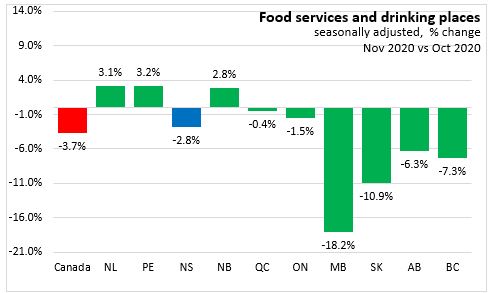
Month-over-Month (Nov 2020 vs Oct 2020, seasonally adjusted)
- Nova Scotia food services and drinking places receipts decreased 2.8% to $120.4 million
- Canada's food services and drinking places receipts decreased 3.7% to $4.5 billion
- Three provinces reported monthly increases in food services and drinking places, with
- Prince Edward Island (3.2%) reporting the largest gain, and
- Manitoba (-18.16%) reporting the largest decline in percentage terms.
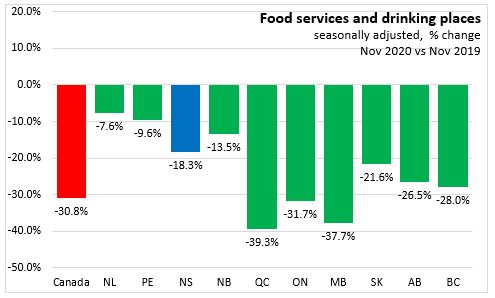
Year-over-Year (Nov 2020 vs Nov 2019, seasonally adjusted)
- Nova Scotia food services and drinking places receipts decreased 18.3%
- Canada's food services and drinking places receipts decreased 30.8%
- None of the provinces reported year-over-year increases in food services and drinking place receipts, with
- Newfoundland and Labrador (-7.6%) reporting the smallest decline and
- Quebec (-39.3%) reporting the largest decline in percentage terms.

Year-to-Date (Jan-Nov 2019 vs Jan-Nov 2020, seasonally adjusted)
- Nova Scotia food services and drinking places receipts decreased 23.6% (-$381.5 million).
- Canada's food services and drinking places receipts decreased 27.5% (-$19.4billion).
- None of the provinces reported year-to-date increases in food services and drinking place receipts, with
- Saskatchewan (-17.8%) reporting the smallest decline and
- Ontario (-30.4%) reporting the largest decline in percentage terms.
NOVA SCOTIA SECTORS
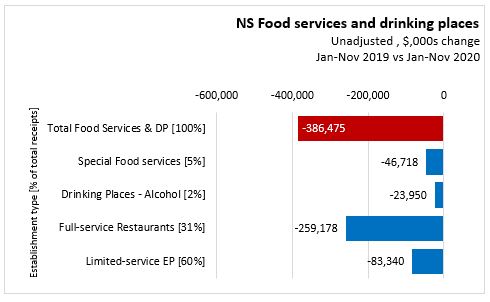
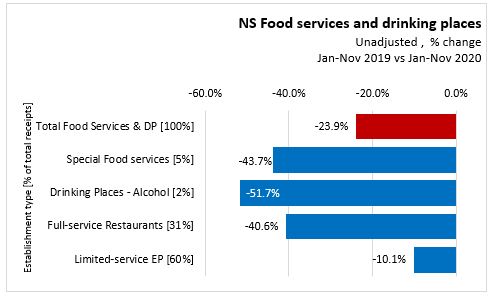
Nova Scotia Year-over-year Sales by Establishment Type (Nov 2020 vs Nov 2019, unadjusted for seasonality)
Compared with Jan-Nov 2019, the reductions in food service and drinking place receipts have been most pronounced for Nova Scotia's full-service restaurants (-$259.2 million). In year-to-date percentage terms, the declines have been more severe for drinking places (-51.7%) and special good services (-43.7%), with a smaller decline for limited service eating places (-10.1%).
- Limited-service eating places, decreased 10.1% (-$83.3 million) to $74.3 million.
- Full-service restaurants decreased 40.6% (-$259.2 million) to $34.6 million.
- Special food services decreased 43.7% (-$46.7 million) to $5.1 million.
- Drinking places -alcoholic beverages decreased 51.7% (-$24.0 million) to $1.9 million.
LONG-RUN TREND
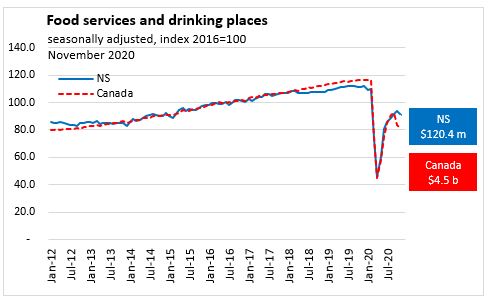
Canada and Nova Scotia (2012 to 2020, seasonally adjusted))
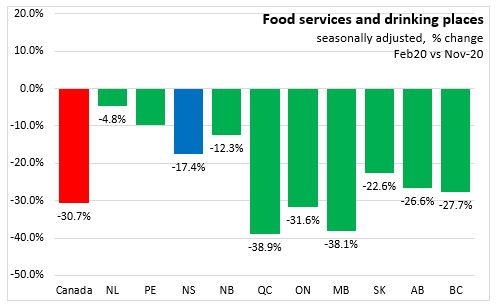
Nova Scotia's Food services and drinking places month over month sales declined sharply in March 2020 (-32.5%) and April 2020 (-38.7%). Recovery began with rapid gains in May 2020 (+31.8%) and June 2020 (+34.7%). Compared to February 2020, Nova Scotia's November 2020 Food services and drinking places sales were still -17.4% below their pre-pandemic levels.
After six consecutive monthly gains. National food services and drinking places sales declined 9.2% to $4.7 billion in October 2020. This decline was mostly due to the second wave of COVID-19 restrictions introduced in several provinces. National food services and drinking places sales were still 30.7% below their pre-pandemic levels.
Source: Statistics Canada. Table 21-10-0019-01 Monthly survey of food services and drinking places (x 1,000)
<--- Return to Archive