The Economics and Statistics Division maintains archives of previous publications for accountability purposes, but makes no updates to keep these documents current with the latest data revisions from Statistics Canada. As a result, information in older documents may not be accurate. Please exercise caution when referring to older documents. For the latest information and historical data, please contact the individual listed to the right.
<--- Return to Archive
For additional information relating to this article, please contact:
January 25, 2021LABOUR FORCE SURVEY HISTORICAL REVISIONS 2001-2020 The Labour Force Survey (LFS) has been revised to align with the most recent population estimates and geographic boundaries based on the 2016 Census and latest classification definitions for industry (NAICS 2017 V3.0) and occupation (NOC 2016 V1.3). This standard revisions process has little impact on key labour market indicators. The revisions to the main LFS tables were released today with further revised tables set to release over next few days.
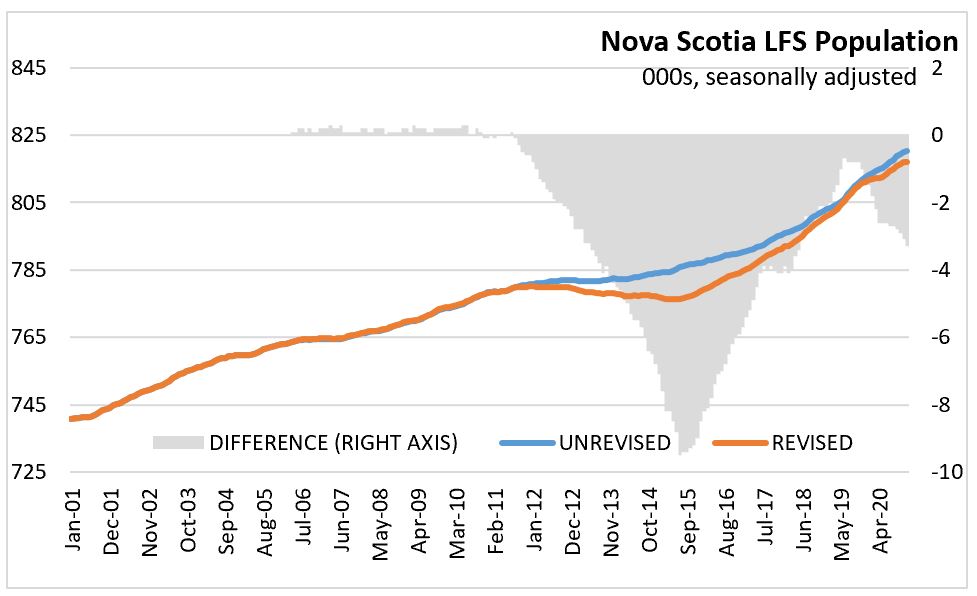
For Canada, the LFS population control totals have generally been revised down from January 2006 to December 2020 but are mostly minor prior to July 2011. Nova Scotia had a similar population rebasing as nationally. Overall, population control totals resulted in downward revisions for Alberta, Quebec, Ontario and Nova Scotia. Nova Scotia downward revisions were largest in 2015 with the LFS population (aged 15 and over, included in LFS sample) declining more from 2012 to 2015, but subsequently growing faster from 2015 through 2019. For Nova Scotia, revisions to 2020 have the LFS population being lower with December 2020 -0.4% or -3,300 lower than the unrevised figures.
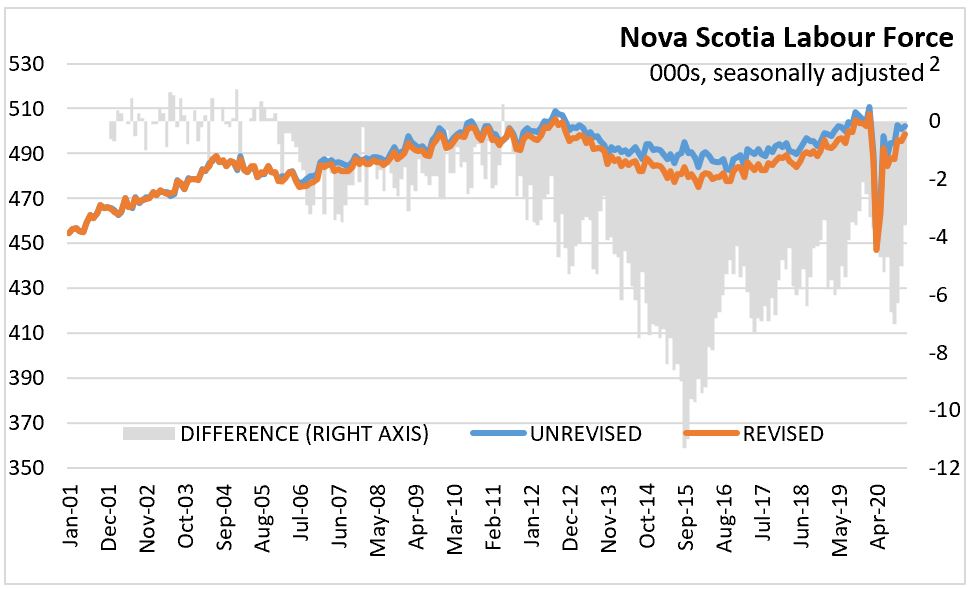
Revisions to Nova Scotia labour force and employment are larger than for population. Labour force and employment revisions from 2006 to 2011 are more notable than the population which had little change during this period. Employment has on average 0.5% lower in the revised data over 2006-2011. The decline over the 2011-2015 is also more pronounced in the revised data with the peak employment revision in September 2015 with 11,500 jobs (-2.5%) fewer in the revised data. The period 2016-2020 for labour force and employment has smaller differences between revised and unrevised data than the proceeding 5 year period. For December 2020, the revisions to both labour force (-0.7%) and employment (-0.9%) are larger than population (-0.4%).

The similar revisions to labour force and employment, leave the unemployment rate about the same over the entire period. The seasonally adjusted monthly unemployment rate averaged 8.7% in the unrevised data and 8.8% in the revised data.

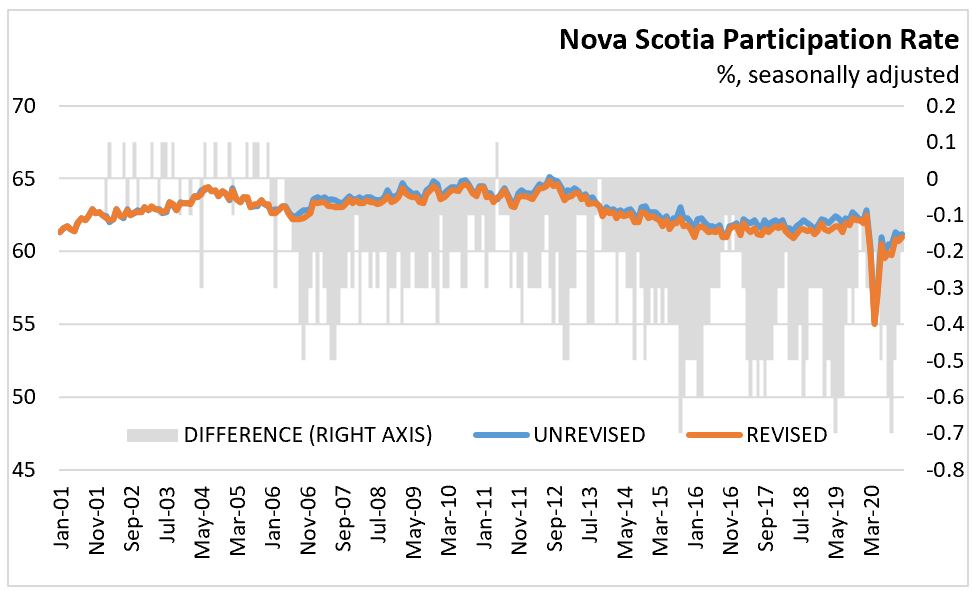
The average participation rate was 62.9% in the unrevised data and 62.7% in the revised data with a fairly consistent change post 2005.
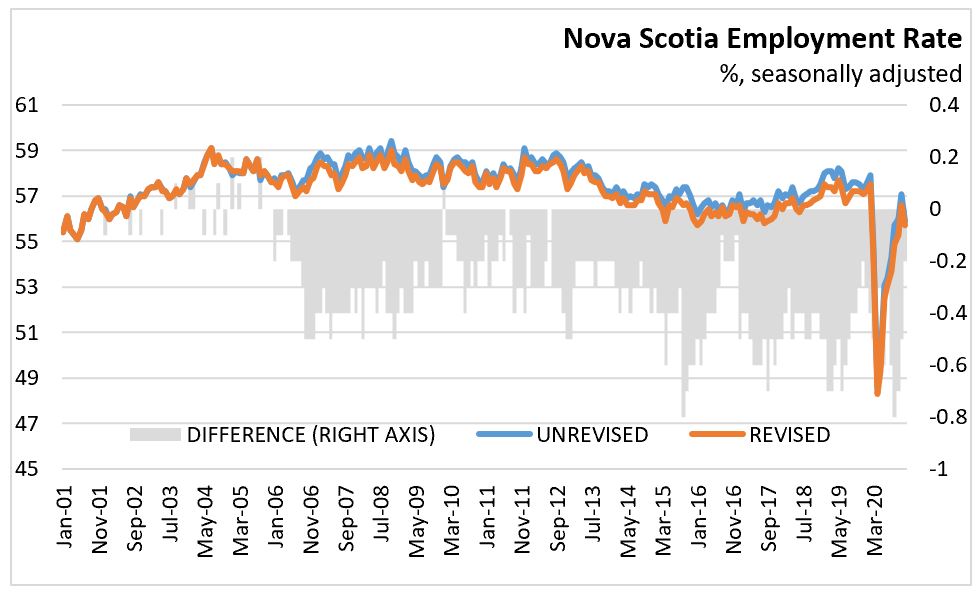
The average employment rate was 57.4% in the unrevised data and 57.2% in the revised data with a fairly consistent difference post 2005.
The revisions to employment averaged a 0.7% lower level over the 2001 to 2020 period. Overall, employment in the goods producing sector was 0.1% higher with higher employment levels in construction (+0.3%), manufacturing (+0.2%) and forestry, fishing, mining, quarrying, oil and gas (+0.1%). Services-producing industries were on average revised lower 0.9% with all subsectors revised lower. The largest downward revisions were in information, culture and recreation (-2.5%), other services (-2.0%), and finance, insurance, real estate, rental and leasing(-1.1%). The smallest downward revision among services was in educational services (-0.3%).

The revisions generally impacted levels with smaller impacts on growth rates. For 2020, the revised data are presented in table below. The revisions to growth rates for 2020 were: downward 0.2 percentage point to 1.0% for population, unchanged -2.1% for labour force, and downward -0.1 percentage points to -4.7% for employment. The unemployment rate for 2020 was revised upward 0.2 percentage points to 9.8%.
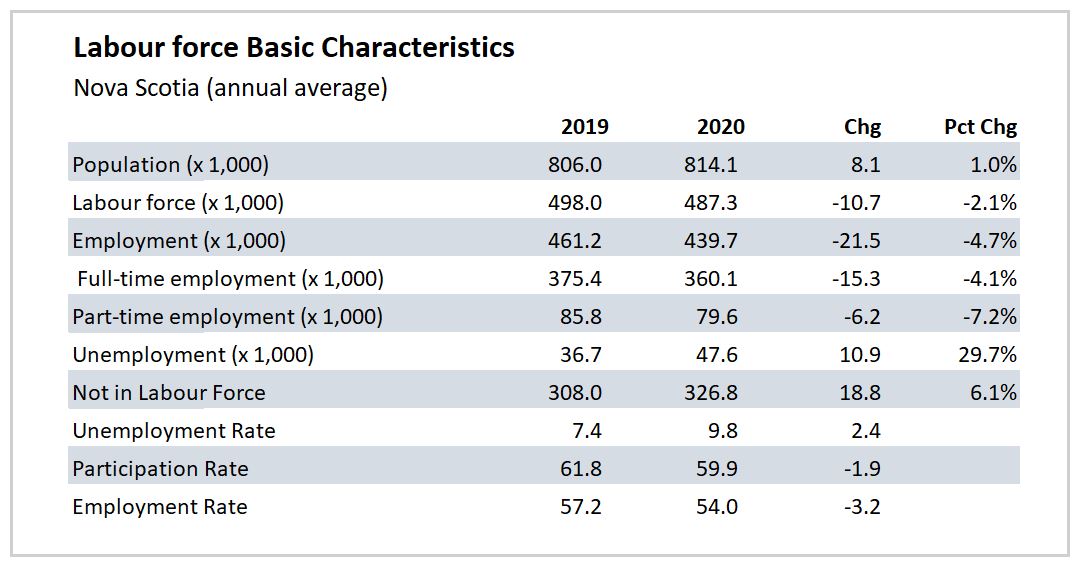
Source: Labour Force Survey: Revisions, 2001 to 2020
<--- Return to Archive