The Economics and Statistics Division maintains archives of previous publications for accountability purposes, but makes no updates to keep these documents current with the latest data revisions from Statistics Canada. As a result, information in older documents may not be accurate. Please exercise caution when referring to older documents. For the latest information and historical data, please contact the individual listed to the right.
<--- Return to Archive
For additional information relating to this article, please contact:
February 25, 2021US GDP 2020 Q4 (SECOND ESTIMATE) 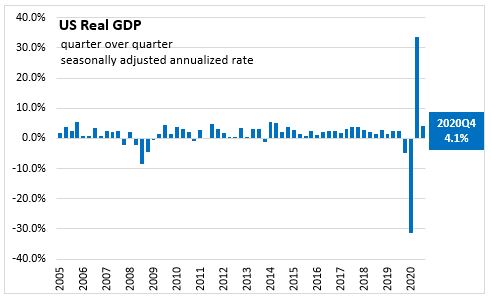
The Bureau of Economic Analysis (BEA) released the Q4 2020 US Real Gross Domestic Product (GDP) second estimate today. The US economy growth rate was revised up 0.1 percentage points to 4.1% in Q4 compared to the advance estimates. Growth in Q4 follows the increase of 33.4% (seasonally adjusted annualized rate, chained 2012 dollars) in Q3 2020. The Q4 GDP estimate reflects continued economic recovery from the sharp declines earlier in the year, as well as ongoing impacts of new COVID-19 restrictions and closures. The BEA also noted that the full economic effects of the COVID-19 pandemic cannot be quantified in the GDP estimate because the impacts are generally embedded in source data and cannot be separately identified. The US economy in Q4 2020 was 2.4% smaller than in Q4 2019.
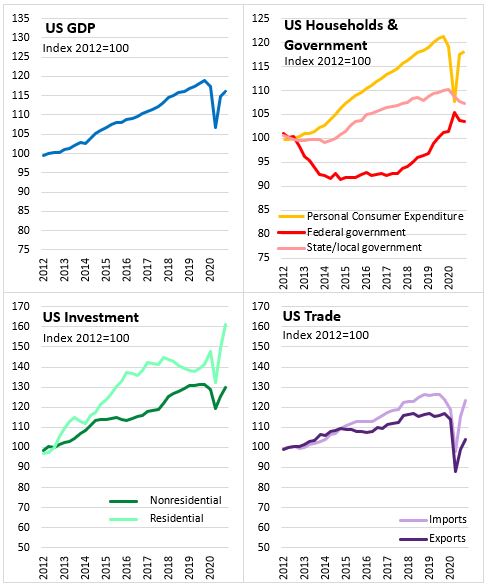
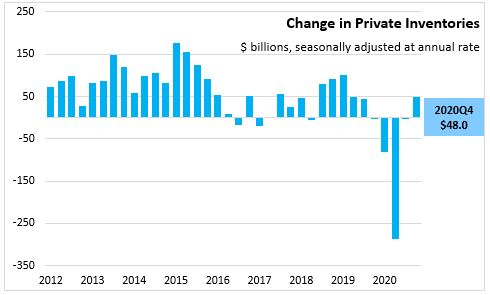
Increased GDP for Q4 reflected positive contributions from exports, non-residential fixed investment, personal consumption, residential fixed investment, and private inventory investment. These gains were partly offset by decreases in state and local government spending and federal government spending.
Personal consumption expenditure growth was 2.4% in Q4 (in real terms at an annualized rate) following a 41.0% increase in Q3. Services growth (+4.0%) was led by increases in health care, while the decline in goods (-0.9%) was led by food and beverage. Personal consumption expenditure was 2.6% smaller in Q4 2020 compared to Q4 2019.
Residential investment growth (+35.8%) primarily reflected investment in new single-family housing. Residential investment activity in Q4 was 14.1% above Q4 2019 levels. Non-residential fixed investment increased 14.0% in Q4 (at an annualized rate) with increases in structures (+1.1%), equipment (+25.7%), and intellectual property products (+8.4%) .
Export growth was 21.8% in Q4 (real terms at annualized rates) following an increase of 59.6% in Q3. Export growth primarily reflected an increase in goods, led by industrial supplies and materials. Compared to Q4 2019, goods exports were 3.6% lower and service exports were 24.1% lower in Q4 2020.
US nominal GDP increased at an annual rate of 6.1% in Q4, following an increase of 38.3% in Q3. The personal consumption expenditure (PCE) price index increased 1.6% compared to a 3.7% increase in the previous quarter.
ANNUAL 2020
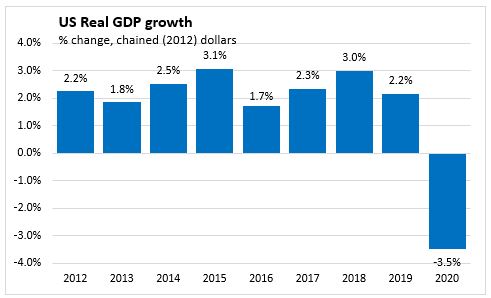
For 2020, the US real GDP declined 3.5% after ten years of positive growth (2010-2019) and the previous downturn in 2009 (-2.5%). The real GDP decline in 2020 was the largest since 1946. The decline in real GDP reflects decreases in personal consumption, inventories, non-residential fixed investment, exports, state and local government that were partially offset be increases in federal government spending and residential investment.
Personal consumption expenditures declined 3.9% with lower service (-7.3%) in food services and accommodations, health care and recreational services. Goods expenditure rose 3.9% with increases in durables (+6.4%) and nondurables (+2.6%). Private nonresidential investment fell 4.0% with lower structures and equipment (led by transportation equipment) but rising intellectual property products (mainly software).
Federal spending (+4.3%) rose on nondefense consumption expenditures that was led by increase purchases of intermediate service for the processing and administration of the Paycheck Protection Program. State and local (-0.8%) spending was down on lower consumption expenditures, led by compensation.
Exports (-13.0%) declined in 2020 with lower services (-19.2%), notably in travel, and goods (-9.5%), mainly in non-automotive capital goods. Imports declined 9.3% in 2020 with fewer services (-22.5%) and goods (-6.1%) being imported into the US in 2020.
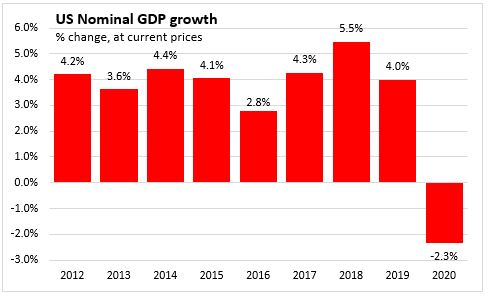
US Nominal GDP declined 2.3% in 2020. The PCE price index increased 1.2% in 2020 following on the 1.5% increase in 2019. Excluding food and energy prices, the PCE price index increased 1.4%.
A seasonally adjusted annualized rate shows what the percent change would be if the quarterly rate continued for four quarters. It is computed by compounding the quarterly rate for four quarters. Reporting annualized rates facilitates comparability between annual and quarterly growth, but can exaggerate change when series are volatile. The COVID-19 downturns and recovery do not indicate growth in US GDP of 33.4% in Q3 or 4.1% in Q4. It would take four quarters of compounded growth at the same pace as reported for US GDP to change by these amounts. Real GDP is lower 2.8% in Q3 2020 compared to Q3 2019, and 2.4% in Q4 2020 compared to Q4 2019.
Source: US Bureau of Economic Analysis
<--- Return to Archive