The Economics and Statistics Division maintains archives of previous publications for accountability purposes, but makes no updates to keep these documents current with the latest data revisions from Statistics Canada. As a result, information in older documents may not be accurate. Please exercise caution when referring to older documents. For the latest information and historical data, please contact the individual listed to the right.
<--- Return to Archive
For additional information relating to this article, please contact:
March 02, 2021NON-RESIDENTIAL FIXED CAPITAL INVESTMENT, Q4 AND ANNUAL 2020 Non-residential fixed capital investment consists of expenditures made by business, governments and non-profit institutions serving households that add to the capital stock for production of goods and services in an economy. This includes investments in buildings, engineering construction (i.e. bridge, mine structure), machinery and equipment, and intellectual property products (i.e. software, mineral exploration), while non-reproducible assets (lands, mineral deposits, natural resources) and housing investments are excluded. Statistics Canada has begun to release quarterly data on non-residential fixed capital investment and stock for the provinces with historical data back to 2013. Note, the data is not seasonally adjusted and expressed in current prices.
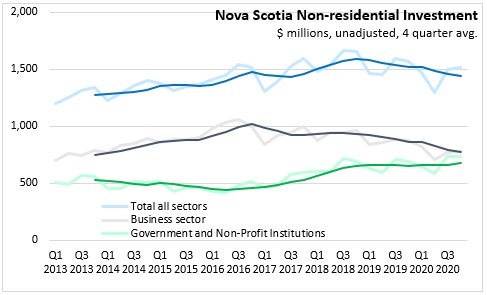
Nova Scotia non-residential investment has trended upwards since Q1 2013, rising from $1,201 million in Q1 2013 to a high $1,667 million in Q3 2018. Total non-residential investments declined to $1,293 million in Q2 2020 then rose to $1,503 million in Q3 and $1,514 million in Q4. Business sector non-residential investment has been on a general decline since 2017, while government investment has increased. In 2020, government and non-profit investments increased compared to the previous year to $735 million (+3.2%) in Q3 and $734 million (+6.4%) in Q4.
Within the business sector, machinery and equipment accounts for around 50% of non-residential investment. Business sector machinery and equipment investment was down 11.1% compared to Q4 2019, an improvement compared to the 18.2% year-over-year decline in Q3. Compared to Q4 2019, business sector investment was down 10.6% for non-residential buildings, 20.5% for engineering construction, 11.1% for machinery and equipment and 0.8% for intellectual property products.

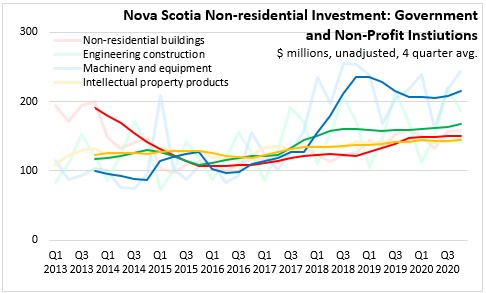
Government investment in machinery and equipment rose through 2018 and has maintained elevated levels through 2019 and 2020, averaging over $200 million per quarter. Compared to Q4 2019, government and non-profit investment is up 6.4%, with increases in engineering construction (+9.4%), machinery and equipment (+12.0%) and intellectual property products (+1.4%).
PROVINCES NON-RESIDENTIAL INVESTMENT: Q4 2020 vs. Q4 2019
Total investment is down 7.5% in Canada and 3.4% in Nova Scotia compared to Q4 2019. The largest declines have been in Newfoundland and Labrador (-14.0%), Saskatchewan (-12.2%), Alberta (-11.6%) and British Columbia (-9.4%).

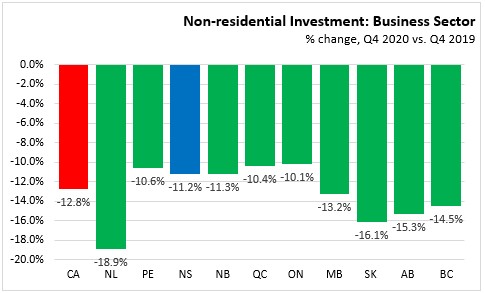
Within the business sector, all provinces reported lower investment in Q4 2020. Nova Scotia non-residential business sector investment is 11.2% lower than Q4 2019 and nationally investment is down 12.8%. The largest declines were in Newfoundland and Labrador (-18.9%), Saskatchewan (-16.1%), Alberta (-15.3%) and British Columbia (-14.5%).
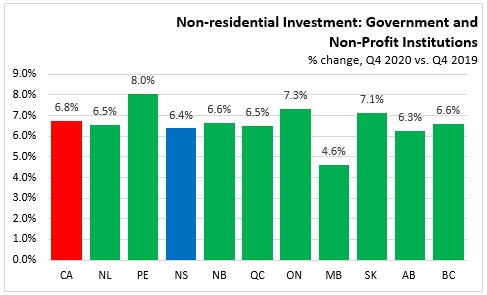
Government and non-profit fixed capital investment is higher in all provinces in Q4 2020. Most provinces increased investment at a rate similar to the national average of 6.8%. Manitoba had the smallest gain at 4.6%, while Prince Edward Island had the largest percentage increase at 8.0%.
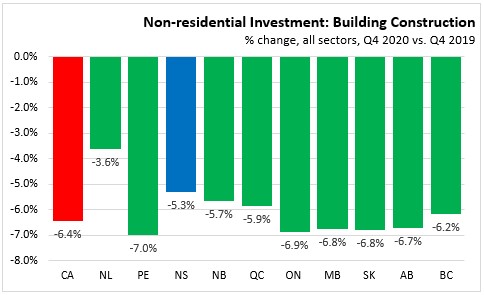
After a rebound in building construction for all provinces in Q3 2020, non-residential investment in buildings lowered for all provinces in Q4. Compared to Q4 2019, building construction decreased 6.4% nationally and 5.3% in Nova Scotia.
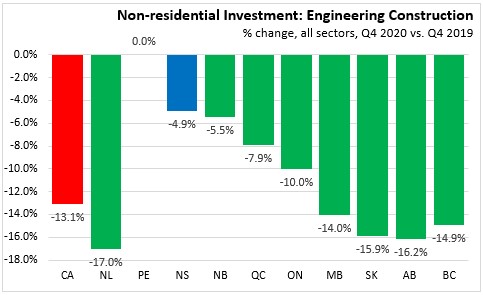
Compared to Q4 2019, engineering structures investment declined in all provinces except Prince Edward Island. Among provinces with lower engineering construction in Q4, the smallest declines occurred in New Brunswick (-5.5%) and Nova Scotia (-4.9%). The largest declines were reported for Prince Edward Island, Ontario, Manitoba, Saskatchewan, and Alberta.
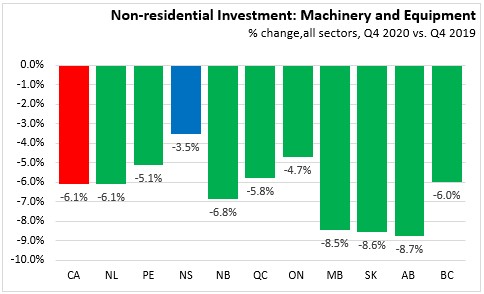
Machinery and equipment, across all sectors, declined 6.1% in Canada (Q4 2020 vs Q4 2019), with all provinces reporting declines. Nova Scotia (-3.5%) had the smallest percentage decline, while Alberta (-8.7%), Saskatchewan (-8.6%) and Manitoba (-8.5%) had the largest declines.
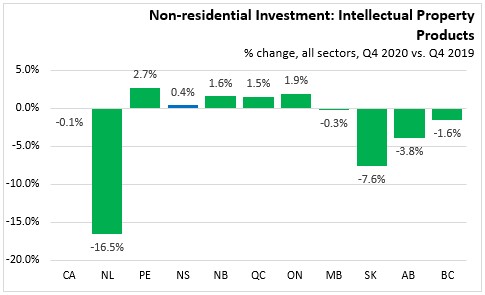
Compared to Q4 2019, intellectual property product investment decreased 0.1% nationally. Investments in Newfoundland were down 16.5% while Prince Edward Island had an increase of 2.7%. Intellectual property product investments rose 0.4% in Nova Scotia, year-over-year.
ANNUAL (2020 vs. 2019)
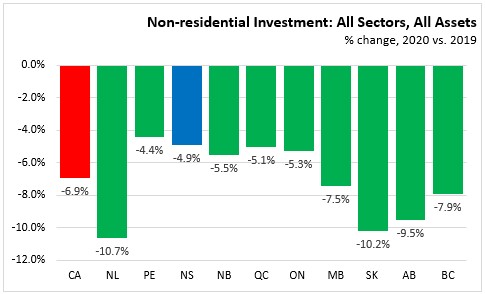
Across all sectors and investment types, non-residential investment declined 4.9% for Nova Scotia in 2020. Nationally, non-residential investment decreased 6.9%. The largest declines occurred in Newfoundland and Labrador (-10.7%), Saskatchewan (-10.2%), and Alberta (-9.5%).
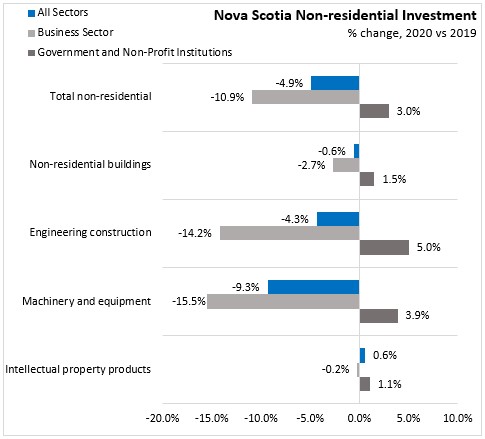
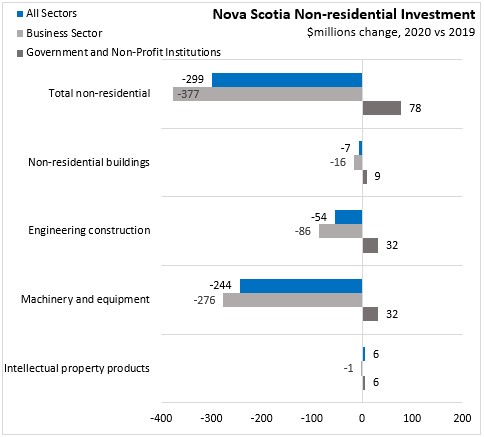
In 2020, non-residential investment in Nova Scotia declined 4.9%, with a 10.9% decline in the business sector and a 3.0% increase among government and non-profit institutions. The largest contributor to the overall decline (-$299 million) has been business investments in machinery and equipment (-$276 million) and engineering construction (-$86 million).
Statistics Canada. Table 34-10-0163-01 Flows and stocks of fixed non-residential and residential capital, by sector and asset, provincial and territorial (x 1,000,000)
<--- Return to Archive