The Economics and Statistics Division maintains archives of previous publications for accountability purposes, but makes no updates to keep these documents current with the latest data revisions from Statistics Canada. As a result, information in older documents may not be accurate. Please exercise caution when referring to older documents. For the latest information and historical data, please contact the individual listed to the right.
<--- Return to Archive
For additional information relating to this article, please contact:
March 12, 2021CANADA NATIONAL BALANCE SHEET ACCOUNTS, Q4 2020 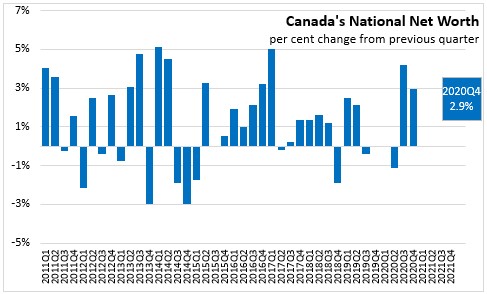
In the fourth quarter of 2020, Canadian national wealth increased 2.9% (or +$354.8 billion) to $12,416.1 billion. This follows a revised increase of 4.2% in the third quarter of 2020. As with the previous quarter, the growth was largely attributable to an increase in the value of residential real estate by 3.3%. Natural resource asset values increased, the second consecutive quarterly increase while the stock of machinery and equipment declined for the third consecutive quarter on weak investment. Net foreign assets increased for the third consecutive quarter as foreign equity prices increased in Q4 2020.
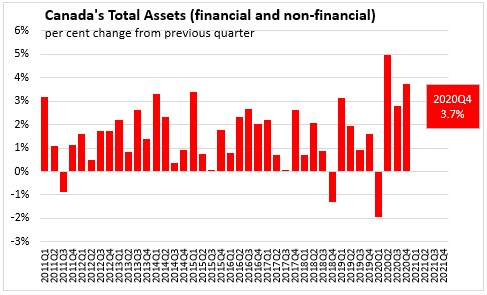
Total assets, including financial and non-financial assets increased by 3.7% to $50,589 billion at the end of Q4 2020, following a 2.8% increase in Q3 2020.
Household sector
In Q4 2020, Canada’s household sector net worth increased 3.7% to $12,788.9 billion. Financial assets increased $285.6 billion, as its main contributors were pension, equity and mutual fund shares along with higher cash holdings and bank deposits. The Toronto Stock Exchange increased 8.1% and international markets also posted strong gains as the Standard and Poor’s 500 increased 11.7%. Financial liabilities increased 1.5%.
The value of non-financial assets grew $211.7 billion in Q4 2020, largely attributable to an increase of 3.4% in residential real estate. Residential resale sales volumes, reflecting activity in the resale housing market, continued strong gains of 5.2% in the fourth quarter, following a large rebound in the third quarter and pent-up demand increased housing prices. Year-over-year the value of residential real state increased 11.6% compared to Q4 2019.
Household borrowing was $36.1 billion in Q4 2020. Non-mortgage net lending increased $1.2 billion. Mortgage lending increased to $34.9 billion, setting a new high after a record higher value in third quarter of 2020.
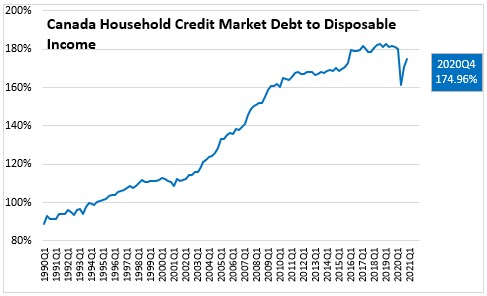
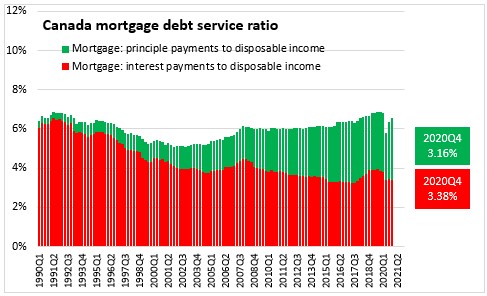
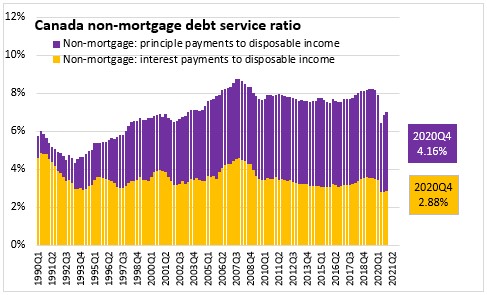
Household credit market debt as a proportion of household disposable income increased to 174.96% in Q4 2020.
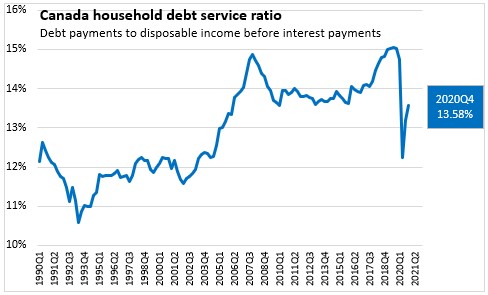
In Q4 2020, household debt payments increased from 13.18% to 13.58% of disposable income (before interest payments). Payment deferrals related to the COVID-19 ended at the end of 2020, the obligated principal rose in Q4 2020.
Government sector
At the end of Q4 2020, general government net debt (book value) increased to 47.86% of GDP. The federal government's net debt to GDP ratio increased to 36.49%, as federal government net debt increase was impacted by COVID-19. Net debt of other levels of government edged up to 27.05% of GDP.

Corporate sector
The credit market debt to equity ratio of non-financial private corporations decreased to 62.88 cents of credit market debt for every dollar of equity in the Q4 2020, down from 64.84 cents (revised) in Q3 2020.

Statistics Canada: Daily
Table 11-10-0065-01 Debt service indicators of households, national balance sheet accounts
Table 36-10-0580-01 National Balance Sheet Accounts (x 1,000,000)
Table 38-10-0235-01 Financial indicators of households and non-profit institutions serving households, national balance sheet accounts
Table 38-10-0236-01 Financial indicators of corporate sector, national balance sheet accounts
Table 38-10-0237-01 Financial indicators of general government sector, national balance sheet accounts
Table 38-10-0238-01 Household sector credit market summary table, seasonally adjusted estimates
<--- Return to Archive