The Economics and Statistics Division maintains archives of previous publications for accountability purposes, but makes no updates to keep these documents current with the latest data revisions from Statistics Canada. As a result, information in older documents may not be accurate. Please exercise caution when referring to older documents. For the latest information and historical data, please contact the individual listed to the right.
<--- Return to Archive
For additional information relating to this article, please contact:
March 23, 2021CANADIAN INCOME SURVEY, 2019 Statistics Canada has released results from the Canadian Income Survey, reporting on incomes for 2019. This includes average and median incomes as well as Canada's official poverty rate, as assessed against the Market Basket Measure.
Poverty Rates
The Market Basket Measure estimates the share of the population that do not have sufficient income for a reference family to afford the cost of a basket of essential goods and services. The MBM threshold is estimated for specific communities. In Nova Scotia, there are separate thresholds for MBM in Halifax, Cape Breton, communities with populations between 30,000 and 100,000, communities with populations under 30,000 and rural areas. The Market Basket has recently been updated to 2018, with historical estimates provided back to 2015. These data are collected through the Canadian Income Survey. Indicators of poverty and income for smaller sub-components of the population may be of limited data quality.
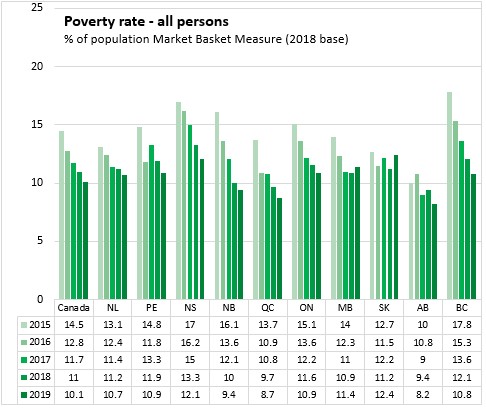
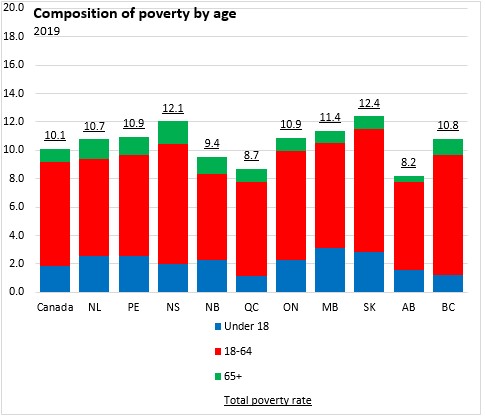
The poverty rate was 12.1% in Nova Scotia in 2019. Nationally, 10.1% of the population had income below the MBM threshold. The lowest poverty rate was in Alberta and the highest in Saskatchewan.

Poverty rates have been declining across Canada. From 2018 to 2019, Nova Scotia's poverty rate fell from 13.3% to 12.1%. The national poverty rate declined from 11.0% to 10.1%. The largest improvements in poverty rates were observed in British Columbia, Alberta and Nova Scotia. From 2018 to 2019 poverty rates increased in both Manitoba and Saskatchewan.
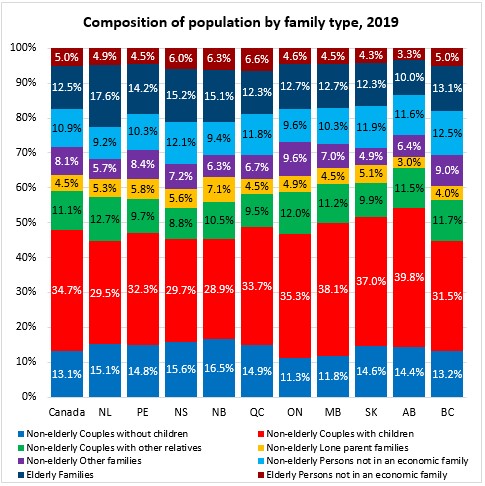
The largest group of persons in poverty in Canada is found among those who are not in economic families and couples with children. Although poverty rates among lone parent families are higher across the country, this is a relatively smaller portion of the population and does not contribute as much to the poverty rate.

Compared with the national average, Nova Scotia's population has a higher share of elderly families, elderly persons not in an economic family, non-elderly couples without children (highest among provinces), lone parents and non-elderly persons not in an economic family.
Nova Scotia's population has relatively fewer non-elderly couple families with children as well as non-elderly families living with other relatives.
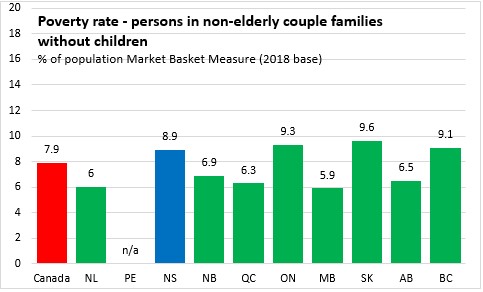
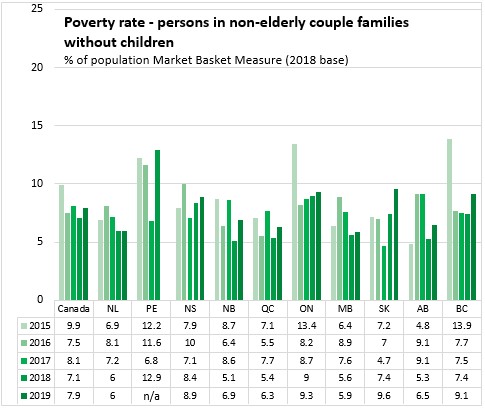
Couple families without children generally have lower poverty rates than the average. In Nova Scotia, the poverty rate for non-elderly couples without children was 8.9% in 2019. Across Canada the poverty rate was 7.9%, with the highest rate in Saskatchewan and the lowest rate in Manitoba.
Nova Scotia's poverty rate among couples without children has been rising since 2017, though it remains below the provincial average. Poverty among couples without children increased nationally as well.
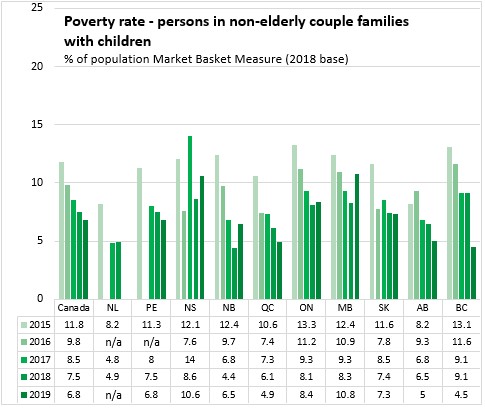
Poverty among couple families with children has been volatile, with large increases and decreases over the past 4 years. In 2019 Nova Scotia's poverty rate for couples with children increased to 10.6%, which is the second highest among provinces (after Saskatchewan). The national poverty rate among couples with children was 6.8% with a low of 4.5% in British Columbia.
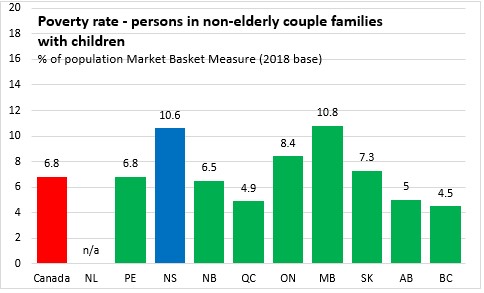
Poverty rates for couples with children have generally been declining across Canada, but in the last year there were increases in Newfoundland and Labrador, Nova Scotia, Ontario and Manitoba.
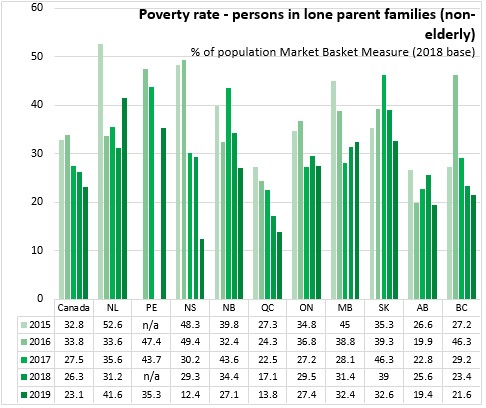
Lone parent families across the country generally report a higher poverty rate. Nova Scotia's lone parents report a poverty rate of 12.4%, which was the lowest in the country. Nationally, the poverty rate among lone parent families was 23.1%, with the highest rate in Newfoundland and Labrador (41.6%).
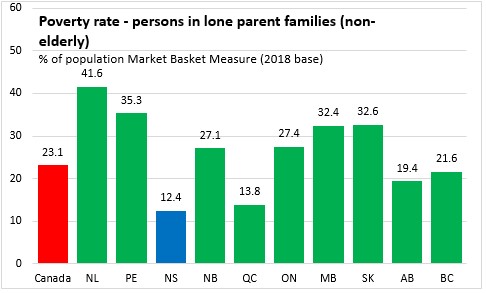
Nova Scotia's poverty rate among lone parent families has been declining since 2016, but the drop from 2018 to 2019 was particularly sharp. Nationally, lone parent poverty rates have also been coming down since 2016.
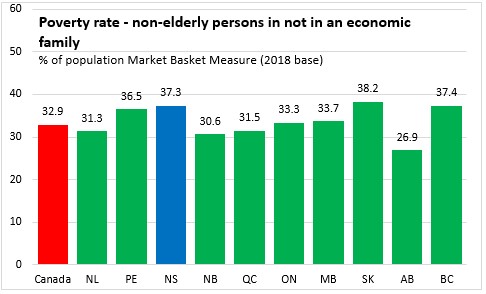
Among non-elderly persons living outside of economic families, the poverty rate remains much higher than average. Nova Scotia's poverty rate among those not in an economic family was 37.3% - third highest after Saskatchewan and British Columbia. Across Canada, the poverty rate among persons not in an economic family was 32.9% with a low of 26.9% in Alberta.
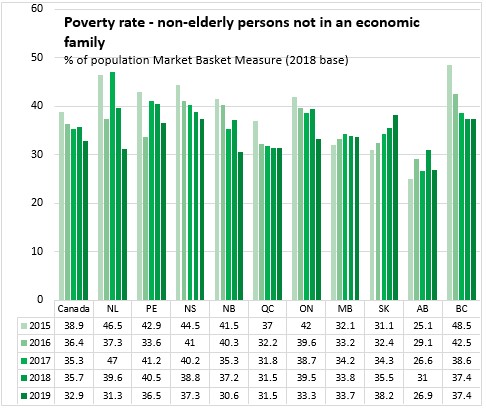
Poverty rates for non-elderly persons not in an economic family have been declining in Nova Scotia since 2015. Across Canada, this poverty rate has generally been declining, with the exception of Saskatchewan.
The composition of poverty by age cohort shows that the population aged 18-64 accounts for the largest portion of poverty (it is also the largest age cohort).
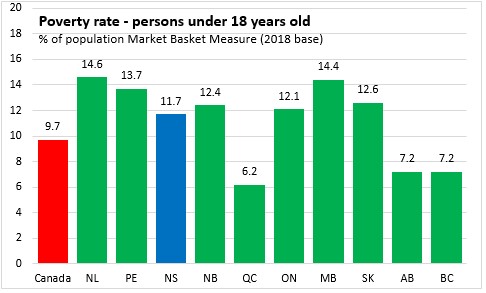
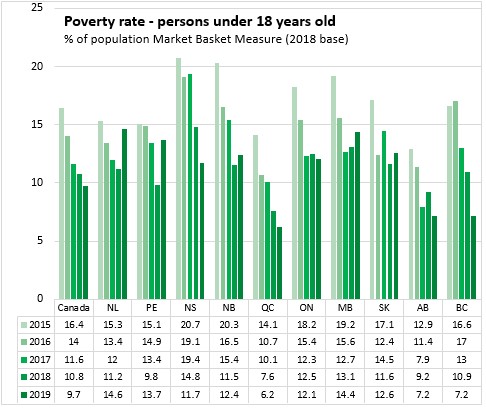
The poverty rate among children aged 17 and under was 11.7% in Nova Scotia. This was above the national average of 9.7%, but below 6 other provinces (led by Newfoundland and Labrador and Manitoba). The lowest rates of child poverty in 2019 were reported in Quebec, Alberta and British Columbia.
The poverty rate for children in Nova Scotia has declined considerably since 2017. National child poverty rates have been falling for several years as well.
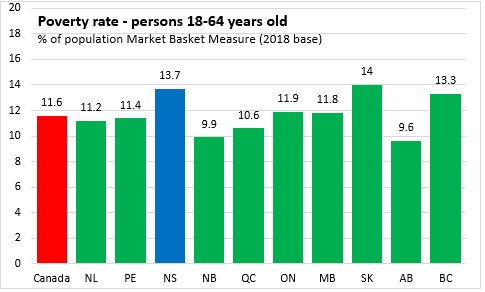
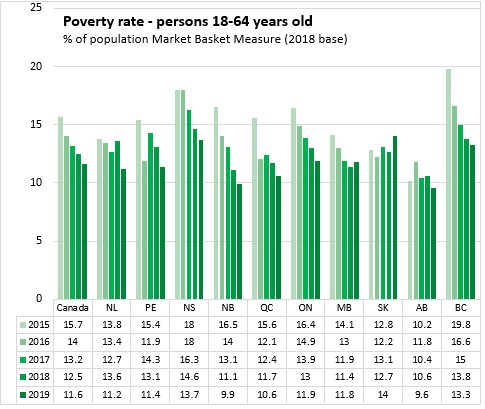
In Nova Scotia, 13.7% of the population aged 18-64 lived with income below the poverty line. This was the second highest portion in the country (after Saskatchewan). Across Canada, the poverty rate for those aged 18-64 was 11.6% with a low of 9.6% in Alberta.
Poverty rates among those aged 18-64 have been trending down in Nova Scotia and across much of the country. In Saskatchewan, poverty rates among those aged 18-64 have been rising.
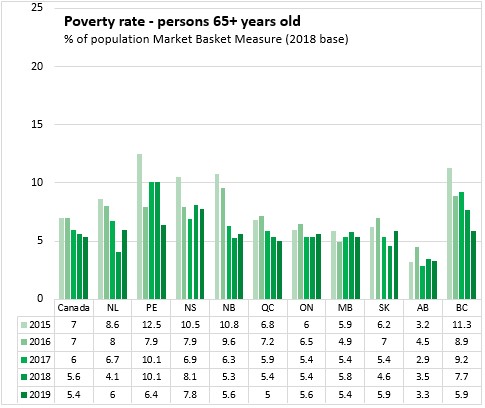
Although poverty rates for those aged 65 and older are generally lower, Nova Scotia reports the highest poverty rate in the country for this age cohort (7.8%). National poverty among older Canadians was 5.4% with a low of 3.3% in Alberta.
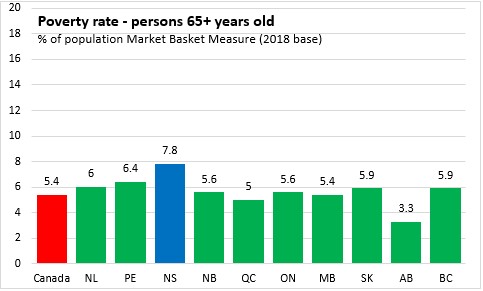
Poverty rates among older Canadians have been trending down, but in the last year, there were increases in Newfoundland and Labrador, New Brunswick, Ontario and Saskatchewan. The poverty rate among older Nova Scotians declined from 2018 to 2019, but this did not offset the increase reported from 2017 to 2018.
Threshold
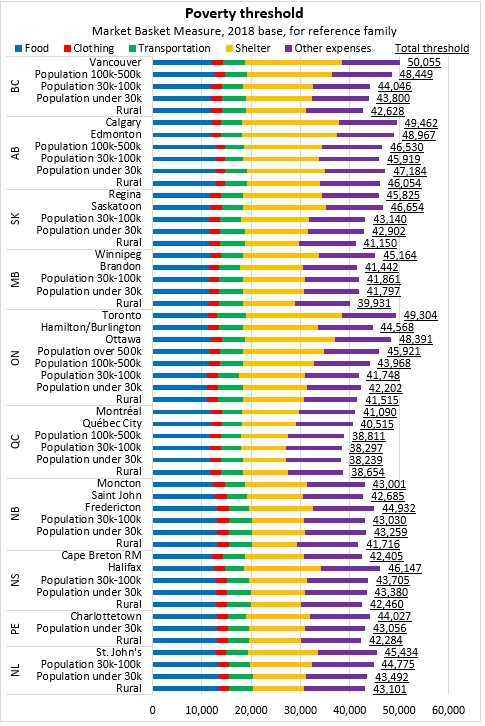
The threshold for the poverty rate varies by province and community size. In Nova Scotia, the income required for a reference family (2 adults, 2 children) to afford a basic standard of living ranged from $42,405 in Cape Breton RM to $46,147 in Halifax. The highest thresholds were reported in larger cities across Ontario, Alberta and British Columbia. The lowest thresholds were in smaller communities of Quebec.
Median Incomes
Median incomes are the level of income at which half the population had higher income and half had lower income. Median incomes are frequently used in making income comparisons because, unlike averages, they are not influenced by outliers with very high values.
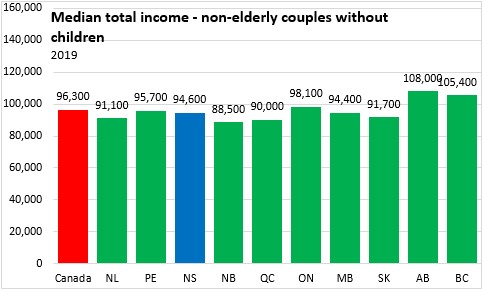
Median income for non-elderly couples without children in Nova Scotia was $94,600 in 2019. National median income was $96,300 with higher incomes in Alberta and British Columbia and lower incomes in New Brunswick and Quebec.
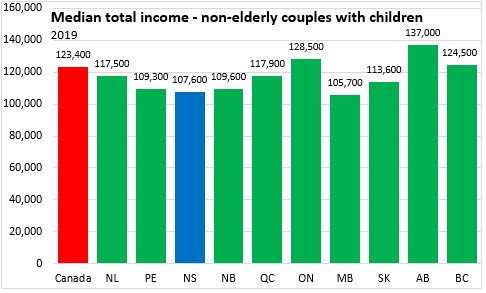
Median incomes for couples with children were higher than for couples without children. The median income of couples with children in Nova Scotia was 107,600 in 2019 (second lowest after Manitoba). National median income for couple families with children was $123,400 with a high of $137,000 in Alberta.
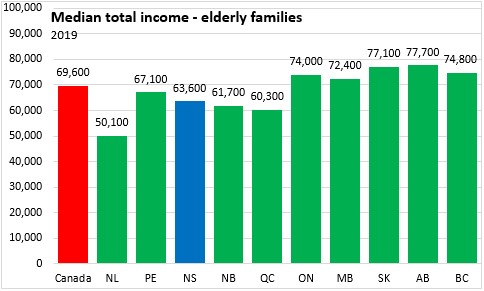
The median income of elderly families was $63,600 in Nova Scotia, which was below the national average of $69,600. Elderly couples in Alberta and Saskatchewan had the highest median incomes in 2019 while those in Newfoundland and Labrador had substantially lower median incomes.
The median incomes of lone parent families and persons not in a census family are typically lower, as couples have more potential earners.
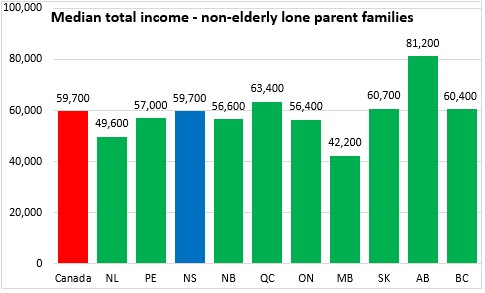
The median income of lone parent families in Nova Scotia was $59,700 - the same as the national average. Lone parent families in Manitoba had substantially lower median incomes while those in Alberta had much higher median incomes.
Among non-elderly persons not in an economic family, the Nova Scotia median income was $33,400 in 2019 (second lowest after Prince Edward Island). National median income for non-elderly persons not in an economic family was $37,900 with a high of $44,400 in Alberta.

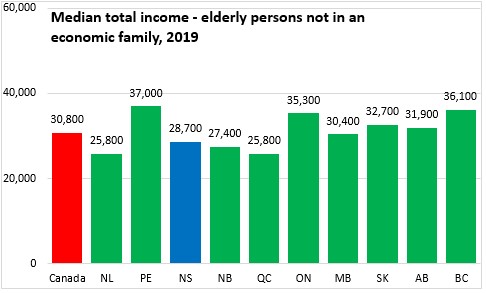
The median income among elderly persons not in an economic family was $30,800 across Canada in 2019. Elderly persons not in an economic family in Nova Scotia had a median income of $28,700. The lowest median income for non-elderly persons not in an economic family was reported in Quebec and the highest in Prince Edward Island.
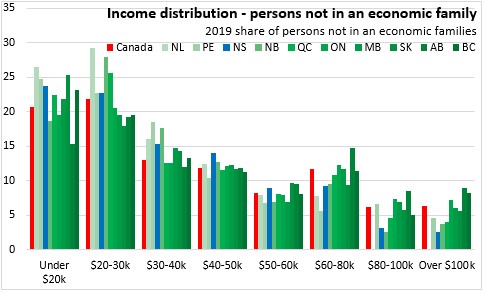
Income distribution
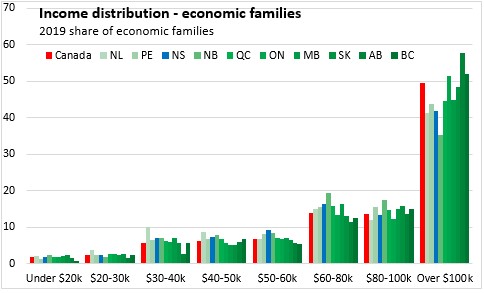
Among economic families, 41.9% of Nova Scotian families had income above $100,000 in 2019 (49.5% nationally). A further 29.8% reported incomes between $60,000 and $100,000 (27.6% nationally) while 16.7% reported incomes between $40,000 and $60,000 (12.9% nationally). A total of 11.6% of Nova Scotia economic families reported income under $40,000 (10.0% nationally).
The distribution of income is notably different among persons not in an economic family. Just 2.6% of Nova Scotians not in an economic family reported income over $100,000 (6.4% nationally). Another 12.3% reported income between $60,000 and $100,000 (17.9% nationally) along with 23.1% that reported income between $40,000 and $60,000 (20.1% nationally). Among Nova Scotians not in an economic family, 38.2% reported incomes between $20,000 and $40,000 (34.9% nationally) while 23.8% (20.7% nationally) reported income under $20,000 in 2019.
Gini coefficient of income distribution
The Canadian Income Survey also reports the Gini coefficient measure of income distribution. Gini coefficients range between zero (representing perfect equality in which all individuals have the same income) and one (representing perfect inequality in which only one person has all the income while others have none). A higher Gini coefficient means greater income inequality.
Gini coefficients can be measured for market income, total income (market income plus transfers) and after tax income (total income less taxes).
Measured by market income, Nova Scotia has a similar income distribution as the national average. However, after factoring government transfers (which are concentrated among those with less income), Nova Scotia's total income Gini coefficient is less than the national average. Likewise, Nova Scotia's after tax Gini coefficient is lower than the national average.
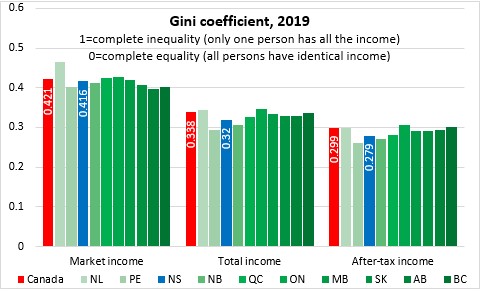
Income inequality has been decreasing since 2017 at both the national and Nova Scotia levels. This has been mainly caused by greater income equality in market sources.

Notes and definitions
The Canadian Income Survey estimates are based on probability samples and are therefore subject to sampling variability. As a result, estimates will show more variability than trends observed over longer time periods.
The market basket measure (MBM) of poverty is based on the cost of a specific basket of goods and services representing a modest, basic standard of living. It includes the costs of food, clothing, footwear, transportation, shelter and other expenses for a reference family. These costs are compared with the disposable income of families to determine whether or not they fall below the poverty line.
An economic family refers to a group of two or more persons who live in the same dwelling and are related to each other by blood, marriage, common-law union, adoption or a foster relationship. This concept differs from the census family concept used for subprovincial data in the Annual Income Estimates for Census Families and Individuals.
The median is the level of income at which half the population had higher income and half had lower. Income estimates are expressed in 2018 constant dollars to factor in inflation and enable comparisons across time in real terms.
After-tax income is the total of market income and government transfers, less income tax.
Market income consists of employment income and private pensions, as well as income from investments and other market sources.
Government transfers include benefits such as Old Age Security, the Guaranteed Income Supplement, the Canada Pension Plan and the Quebec Pension Plan, Employment Insurance, social assistance, the goods and services tax credit, provincial tax credits, and various types of child benefits.
Sources: Statistics Canada, Canadian Income Survey:
Table 11-10-0134-01 Gini coefficients of adjusted market, total and after-tax income
Table 11-10-0135-01 Low income statistics by age, sex and economic family type
Table 11-10-0136-01 Low income statistics by economic family type
Table 11-10-0190-01 Market income, government transfers, total income, income tax and after-tax income by economic family type
<--- Return to Archive