The Economics and Statistics Division maintains archives of previous publications for accountability purposes, but makes no updates to keep these documents current with the latest data revisions from Statistics Canada. As a result, information in older documents may not be accurate. Please exercise caution when referring to older documents. For the latest information and historical data, please contact the individual listed to the right.
<--- Return to Archive
For additional information relating to this article, please contact:
March 31, 2021HOUSEHOLD ACTUAL FINAL CONSUMPTION, 2019 Statistics Canada's system of macroeconomic accounts measures household final consumption based on purchases of final goods and services from market sources by households. Household actual final consumption expenditures expand this to include the value of goods and services provided to households in kind by governments and non-profit institutions.
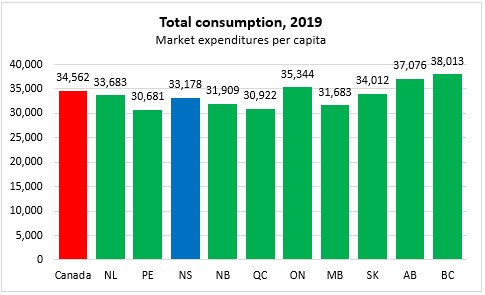
In 2019, household final consumption expenditures on market goods and services amounted to $33,178 per capita in Nova Scotia. Nationally, per capita household final consumption expenditures on market goods and services were $34,562 - ranging from a high of $38,013 in British Columbia to a low of $30,681 in Prince Edward Island.
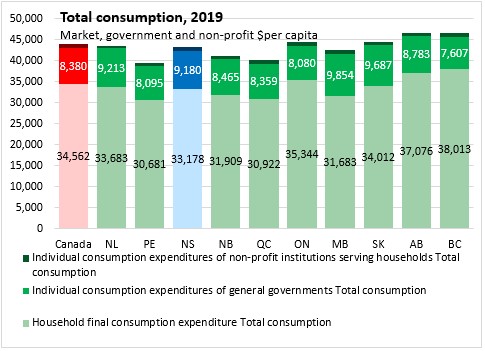
The value of government services added $9,180 per capita to household consumption in Nova Scotia while non-profit institutions added $826 per capita. Across Canada, government expenditures added $8,380 to per capita household consumption while non-profits added a total of $942. Government expenditures for households was highest in Manitoba at $9,854 per capita and lowest in British Columbia at $7,607 per capita. Non-profit expenditures for households were highest in Manitoba ($1,105 per capita) and were lowest in Prince Edward Island ($617).
Household actual final consumption in Nova Scotia (including market, government and non-profit) amounted to $43,183 per capita, which was $700 less than the national average of $43,883 per capita. The highest household actual final consumption was in Alberta at $46,687 and lowest in Prince Edward Island at $39,393.
Non-market expenditures that benefit households fall into a few different categories: health, educaiton, recreation/culture, housing and miscellaneous (including social protection).
The largest non-market expenditures that benefit households were government expenditures on health. Health spending by governments is considerably larger than private, market-based expenditures on health care for households.
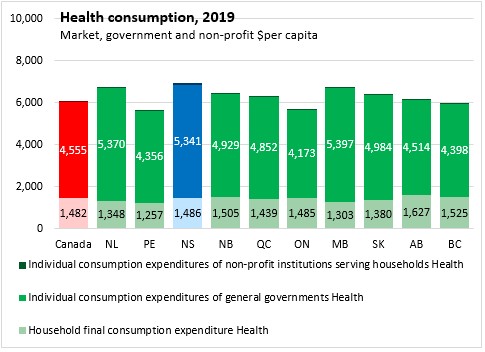
Nova Scotia's government expenditure for household health amounted to $5,341 per capita in 2019 - second highest in the country after Manitoba at $5,397. National health expenditures for households were $4,555 per capita. The lowest government expenditures for household health were in Ontario at $4,173 per capita.
Non-profit expenditures on health for households were comparatively small at $40 per capita. Nova Scotia's non-profit health expenditures for households were $88 per capita in 2019 (highest among provinces).
Combining market, government and non-profit health expenditures for households, Nova Scotia had the highest household health expenditures per capita at $6,915. The national average was $6,076 and the lowest expenditures were in Prince Edward Island ($5,617).
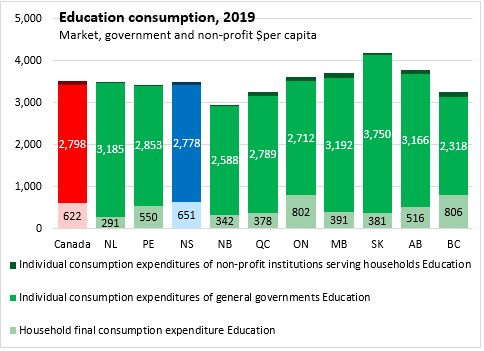
Education expenditures were the second largest category of non-market spending that benefitted households. Nova Scotia's government education expenditures for households were $2,778 per capita (considerably larger than the $651 per capita in market expenditures). National government education expenditures for households were $2,798 per capita with a high of $3,750 in Saskatchewan and a low of $2,318 in British Columbia.
As with health care, non-profit education expenditures for households were smaller at $91 per capita nationally ($52 per capita in Nova Scotia).
Household actual final consumption of education amounted to $3,510 per capita nationally and $3,481 per capita in Nova Scotia. Including market, government and non-profit expenditures, the highest household actual final consumption expenditures on education were in Saskatchewan ($4,185) and the lowest in New Brunswick ($2,949).
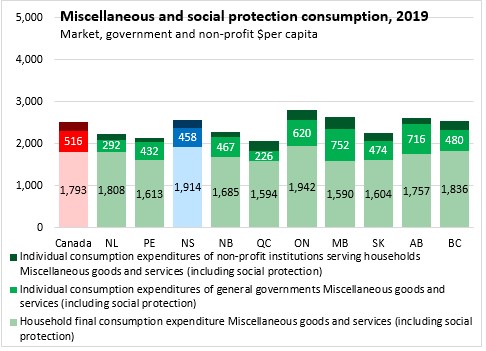
The next three largest categories of non-market expenditures for households were miscellaneous (including social protection), recreation/culture and housing/utilities. In all three, market household final consumption expenditures were much larger than government and non-profit expenditures serving households.
Government expenditures on miscellaneous/social protection amounted to $458 per capita in Nova Scotia in 2019 ($516 per capita nationally) while non-profit expenditures amounted to $195 per capita in 2019 ($219 per capita nationally).
Recreation and culture expenditures by governments for households amounted to $373 per capita in Nova Scotia in 2019; non-profit expdenditures were $43 per capita. These were considerably less than the $2,553 in household expenditures in the market for recreation and culture. Nationally, government recreation and culture expenditures for households were $354 per capita; non-profit expenditures were $34 per capita and private market expenditures were $2,715.

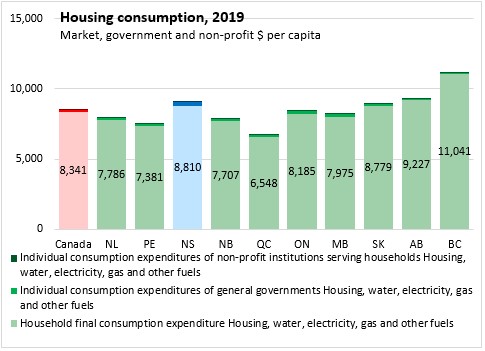
Housing consumption expenditures (including water and energy) were overwhelmingly private market expenditures in 2019 - ranging from $6,548 per capita in Quebec to $11,041 per capita in British Columbia. Nova Scotia household market spending on housing/utilities was $8,810 per capita. Government housing/utilities expenditures for households was $229 per capita in Nova Scotia in 2019 ($158 per capita nationally). Non-profit housing/utilities expenditures for households were $19 per capita in Nova Scotia in 2019 ($22 per capita nationally).
Notes: Household actual final consumption consists of the consumption of goods and services by households. The value of household actual final consumption is given by summing the following three components:
- The value of household expenditures on consumption of goods or services including expenditures on non-market good or services sold at prices that are not economically significant
- The value of the expenditures incurred by government units on individual consumption of goods or services provided to households as social transfers in kind
- The value of the expenditures incurred by non-profit institutions serving households on individual consumption of goods or services provided to households as social transfers in kind.
Source: Statistics Canada. Table 17-10-0005-01 Population estimates on July 1st, by age and sex; Table 36-10-0609-01 Household actual final consumption, Canada, provincial and territorial, annual (x 1,000,000)
<--- Return to Archive