The Economics and Statistics Division maintains archives of previous publications for accountability purposes, but makes no updates to keep these documents current with the latest data revisions from Statistics Canada. As a result, information in older documents may not be accurate. Please exercise caution when referring to older documents. For the latest information and historical data, please contact the individual listed to the right.
<--- Return to Archive
For additional information relating to this article, please contact:
April 09, 2021LABOUR MARKET TRENDS - MARCH 2021 LABOUR MARKET TRENDS - MARCH 2021
Labour force survey results reflect the period from March 14 to 20. Compared to the previous reference week in February 2021, public health measure were less restrictive. Ontario’s stay-at-home measures were lifted for all regions but personal care services, recreation facilities and in-person dining remain closed in GTA. Quebec had lifting of restrictions for restaurants and entertainment facilities in regions outside Montreal. Measures eased in Newfoundland and Labrador, Manitoba, Saskatchewan, Alberta, Prince Edward Island, and Nova Scotia.
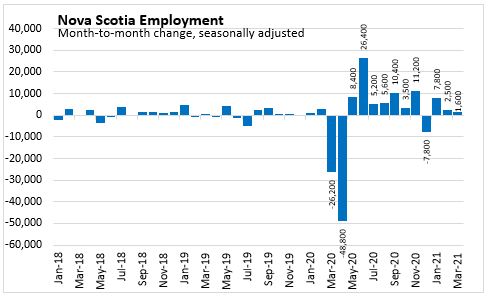
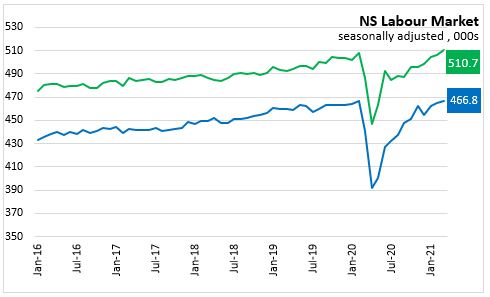
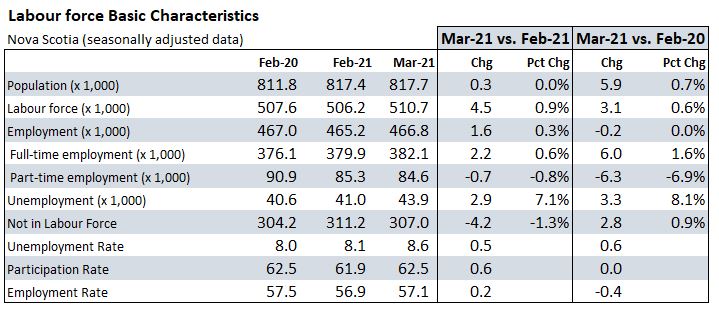
Nova Scotia’s seasonally adjusted employment level was up 1,600 (+0.3%) to 466,800 in March 2021.
Nova Scotia’s employment is essentially (-0.0%) at the pre-COVID level of February 2020 with employment measured as having 200 fewer jobs. Nova Scotia has recovered 99.7% (74,800) of the peak employment loss reported in April (75,000). In comparison, Canada has recovered 90.1% (2.693 million) of April peak employment losses (-2.989 million).
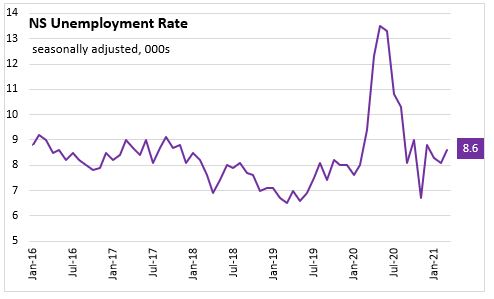
Nova Scotia’s labour force increased 4,500 (+0.9%) to 510,700 in March. The labour force in March 2021 was larger by 3,100 (+0.6%) than February 2020 with population growth of 5,900 (+0.7%) since pre-pandemic period. Nova Scotia’s labour force was at its largest size on record. The number of unemployed persons increased 2,900 compared to last month and is 3,300 higher compared to February 2020.
With a proportionally larger increase in labour force than employment, the unemployment rate increased 0.5 percentage points from last month to 8.6% in March 2021.
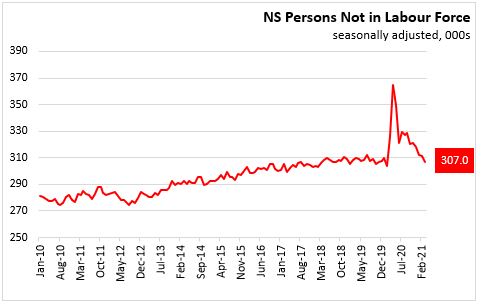
The population not in the labour force decreased 4,200 compared to last month. Compared to February 2020, there were an additional 2,800 persons not in the labour force.
In March, full-time employment increased 2,200 (+0.6%) while part-time employment decreased 700 (-0.8%). Employment since February 2020 has increased by 6,000 (+1.6%) in full-time jobs but is lower by 6,300 (-6.9%) in part-time jobs. Full time employment was at its highest level ever in March. Changes in the number of hours worked within one job can result in shift employment between part-time and full-time.
The participation rate was up 0.6 percentage points to 62.5% in March and is now at the same level observed in February 2020. The employment rate increased 0.2 percentage points to 57.1% and is down 0.4 percentage points compared to the February 2020 level.
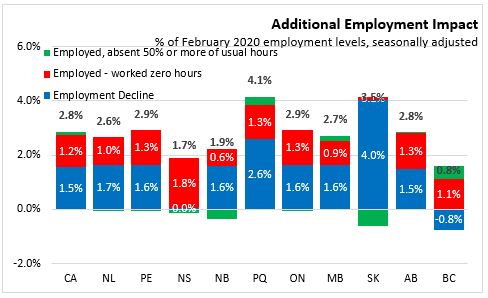
In addition to the employment decline from February 2020, there were elevated numbers of persons who are counted as employed, but have zero hours (for non-routine reasons like vacation, maternity/parental leave, labour dispute) or had their hours cut by 50% or more. In March 2021 in Nova Scotia there were 27,700 persons employed but at less than 50% of their usual hours (including zero hours), up from 24,100 in February 2021 and still elevated by 7,900 compared to 19,800 in February 2020. Combined with those who have lost employment, this amounts to about 1.7% of Nova Scotia’s February 2020 employment level; down from a high of 28.1% in April 2020. The largest total employment/hour impact in March 2021 was Quebec (4.1%) and the smallest was in British Columbia (0.8%) followed by Nova Scotia (1.7%).
Statistics Canada reported in supplemental information that Nova Scotia had a decrease of 500 (Feb-21 to Mar-21) of people who were not in the labour force but wanted to work, currently at 16,000 people. This is down from the 55,600 people in April 2020.
The labour underutilization rate (COVID-19 impact definition) is the proportion of the potential labour force (labour force + those wanting work) that is either unemployed, not in labour force but wanted work or employed but have lost the majority of their usual hours.
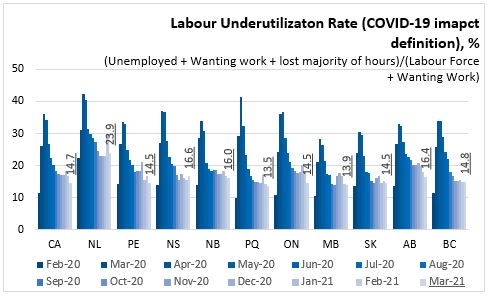
Labour underutilization has declined from highs during March and April 2020 but remains higher compared to February 2020 in all provinces. In February 2020, Nova Scotia's labour underutilization rate was 14.1%. This underutilization increased to 37.1% in April 2020 and subsequently fell 15.6% in November 2020. Labour underutilization rose in December to 17.3% and then fell again to 16.6% by March 2021. Newfoundland and Labrador reported the highest labour underutilization in March 2021 while Quebec (13.5%) reported the lowest.
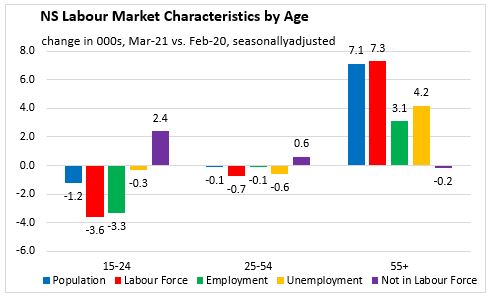
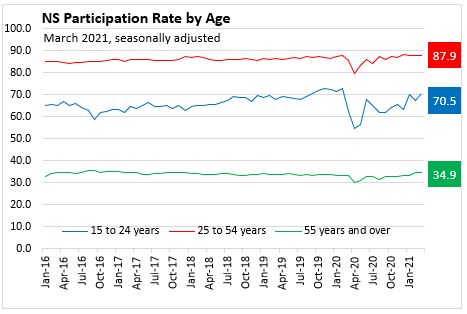
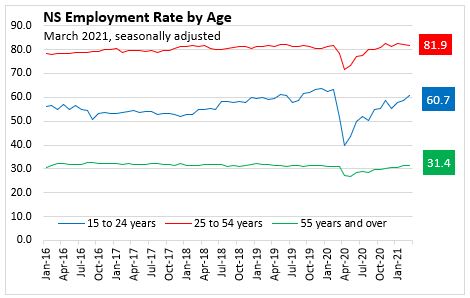
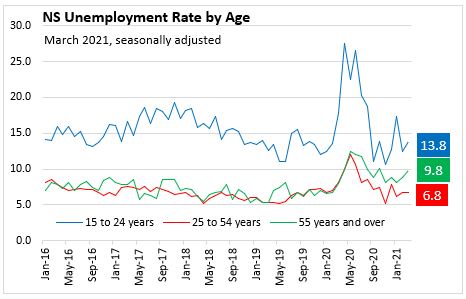
Age Cohorts
When compared to February 2020, the remaining shortfall in employment was mostly attributable to declines in the youth cohort (ages 15-24). Employment among youth was down 3,300 from February 2020 to March 2021 while the labour force declined by 3,600. For core-aged workers (ages 25-54), employment declined slightly (-100) while labour force was down by 700. For older workers, employment increased 3,100 from February 2020 while the labour force was up 7,300 (in line with population growth for the older cohort).
The unemployment rate increased for youth and older workers and remained flat for core-aged workers in Nova Scotia in March 2021. Compared to the previous month, unemployment rate increased 1.3 percentage points to 13.8% for youth workers (ages 15-24), and 1.0 percentage points to 9.8% for older workers (ages 55 and over). For core-aged workers (ages 25-54), unemployment rate was unchanged at 6.8% in March 2021.
The participation rate showed a similar trend as unemployment rate. The participation rate for younger Nova Scotians increased 3.3 percentage points to 70.5% and was up 0.4 percentage points to 34.9% for older workers. For core-aged workers, the participation rate declined 0.1 percentage points to 87.9%.
Compared to February 2021, employment rate declined by 0.1 percentage points to 81.9% for core-aged workers and to 31.4% for older workers, respectively, in March 2021. For younger Nova Scotians, employment rate increased 2.0 percentage points to 60.7% in March 2021.
Compared with February 2020, employment rates were down for youth (-2.4 percentage points) but higher for older workers (+0.2 percentage points). Employment rate for core-aged workers was unchanged from February 2020.
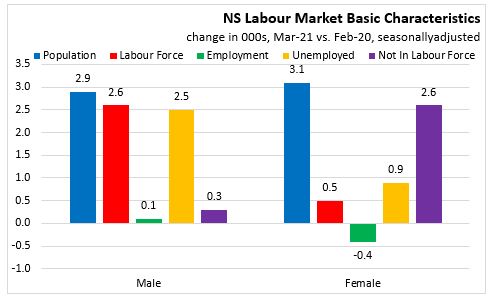
Males and Females
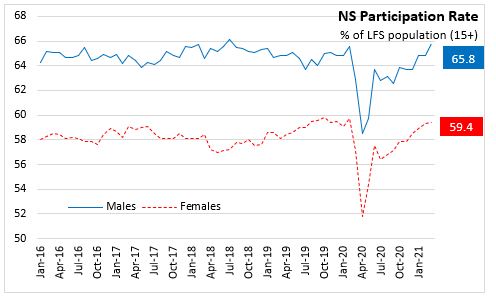
Female employment was 400 (-0.2%) below its pre-pandemic level seen in February 2020 while male employment was up slightly by 100 (+0.0%) in March 2021. Compared to February 2020, the male labour force was up 2,600 (+1.0%) and the female labour force has increased by 500 (+0.2%). The number of unemployed males has increased by 2,500 and the number of unemployed females was up 900. The male population not in the labour force was up 300 from February 2020 while the number of females not in the labour force grew by 2,600.
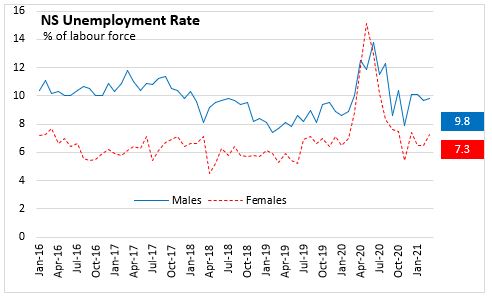
In March 2021, the monthly unemployment rate increased 0.8 percentage points to 7.3% for female workers and was slightly up 0.1 percentage points to 9.8% for male workers.
The participation rate increased for both males and females. Male participation rate increased 1.0 percentage points to 65.8% and the female participation rate increased 0.1 percentage points to 59.4% in March 2021.
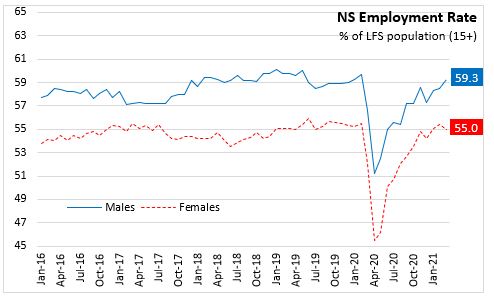
The monthly employment rate was up 0.8 percentage points to 59.3% for males but was down 0.4 percentage points to 55.0% for females.
Sectors and Industries
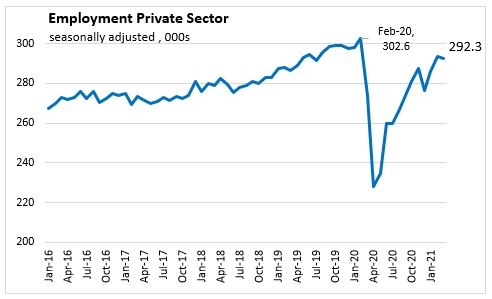
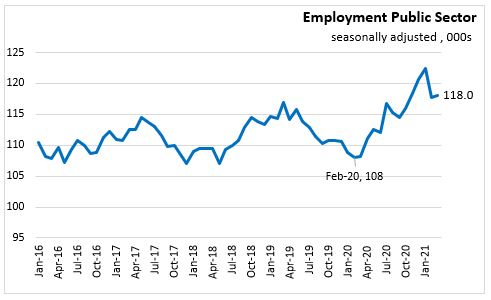
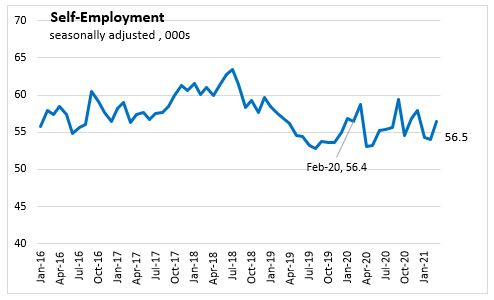
The monthly employment gain from February to March was mostly in self-employed (+2,500) with only a small change (+300) in public sector employees and a decline of 1,200 in private sector employees.
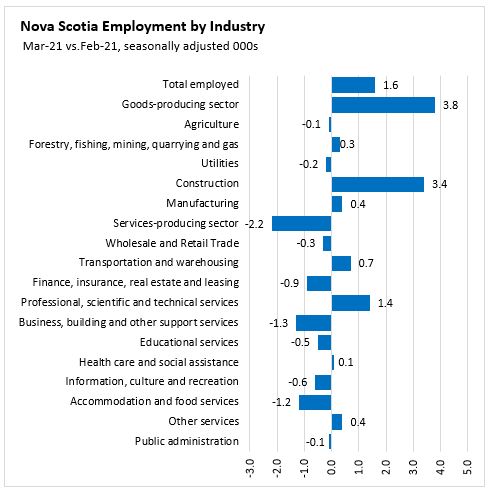
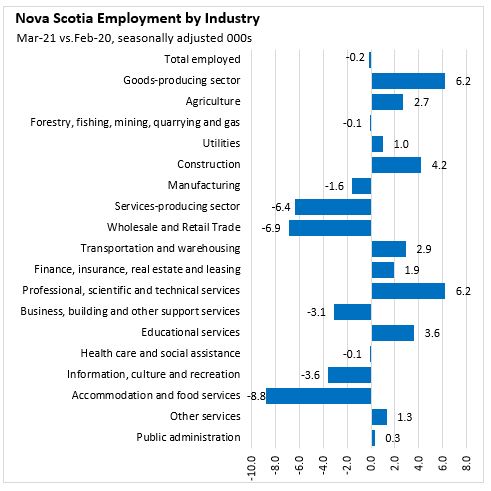
For February, goods-producing sector employment was up 3,800 jobs with construction (+3,400) accounting for most of the increase.
Service-producing sector employment decreased 2,200 in March. Employment declined in seven of eleven service subsectors with the largest decreases in business, building and other support services (-1,300) and accommodation and food services (-1,200). Professional, scientific and technical services added 1,400 jobs in March 2021.
Compared to February 2020, employment remains lower in the private sector (-10,300) while public sector employees (+10,000) and self-employed (+100) are at higher levels.
Employment since February 2020 was 6,200 higher in goods-producing industries with higher levels in agriculture (+2,700), utilities (+1,000) and construction (+4,200) offsetting declines in manufacturing (-1.600) and forestry, fishing, mining, quarrying, oil and gas (-100).
Service-producing employment was lower by 6,400 since February 2020 with the lower levels in wholesale and retail trade (-6,900), accommodation and food service (-8,800), information, culture and recreation (-3,600) and business, building and other support service (-3,100) being at significantly lower levels.
Employment levels were higher in March 2021 than February 2020 in some service subsectors including the largest increases in professional, scientific, and technical services (+6,200), educational services (+3,600), transportation and warehousing (+2,900), and finance, insurance, real estate and leasing (+1,900).
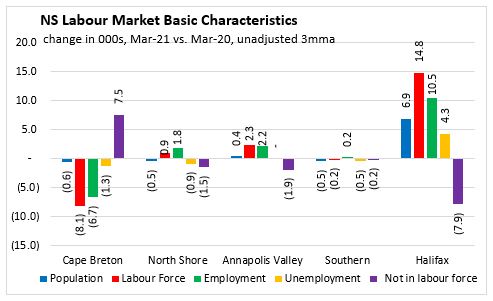
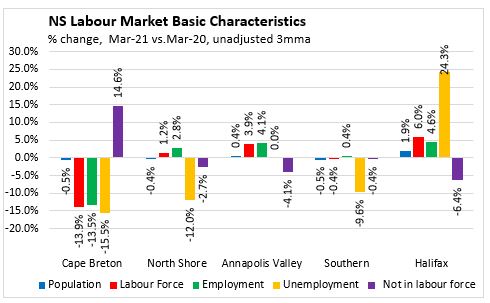
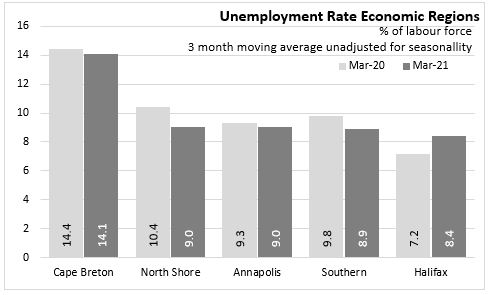
Regions – March 2021 vs March 2020 (unadjusted 3 month moving average)
Compared with March 2020, Cape Breton employment declined by 6,700 (-13.5%) while the labour force was down 8,100. The number of unemployed people declined 1,300 and the unemployment rate decline 0.3 percentage points to 14.1%. There are an additional 7,500 persons not in the labour force in Cape Breton compared to March 2020 data.
For the North Shore region, the labour force increased by 900 and employment was up 1,800. The number of unemployed was down by 900. The unemployment rate declined 1.4 percentage points to 9.0% in March.
The Annapolis Valley reported an increase in both labour force (+2,300) and employment (+2,200) when compared to March 2020. The unemployment rate declined 0.3 percentage points to 9.0%. The number of persons not in the labour force declined 1,900 from a year earlier.
In the Southern region, labour force declined by 200 while employment was up 200 from the previous year. The number of unemployed was down 500 and the unemployment rate declined 0.9 percentage points to 8.9%.
In the Halifax region, the labour force posted an increase of 14,800 (+6.0%) while employment has increased 10,500 (+4.6%) compared to March 2020. With unemployment increasing 4,300, the unemployment rate increased 1.2 percentage points to 8.4%. The number of persons not in the labour force decreased by 7,900 in Halifax from a year ago.
Provincial Comparisons
Nine provinces reported increasing employment in March with Saskatchewan reporting no change. The largest increases this month were in Newfoundland and Labrador (+6.5%) and Ontario (+2.5%).
Statistics Canada notes that there were eased restrictions on certain economic activities in most provinces.

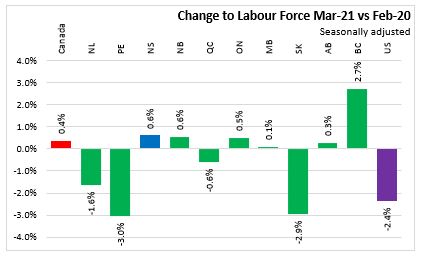
Compared to February 2020, the labour force is now higher in six provinces including Nova Scotia. British Columbia (+2.7%) has seen the largest growth in labour force from pre-pandemic levels. The largest declines in the labour force since February 2020 are in Prince Edward Island (-3.0%) and Saskatchewan (-2.9%).
British Columbia (+0.8%) employment now exceeds the pre-pandemic level from February 2020. Nova Scotia employment is essentially (-0.0%) at the same level as February 2020. The largest employment declines since February 2020 are in Saskatchewan (-4.0%) and Prince Edward Island (-3.2%).

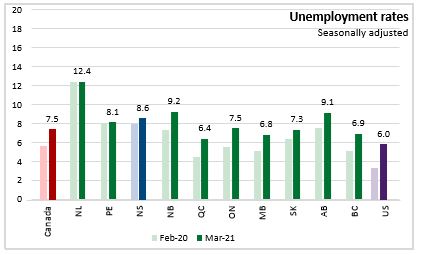
Unemployment rates were up in two provinces compared to last month– Nova Scotia and New Brunswick. The highest unemployment rate for March 2021 was in Newfoundland and Labrador at 12.4% and the lowest was in Quebec at 6.4%. Canada’s unemployment rate was 7.5% in March 2021. Unemployment rates were higher in all provinces, except Newfoundland and Labrador where they are the same, compared to February 2020.
National Comparisons: Cities (Monthly, 3 month moving average)
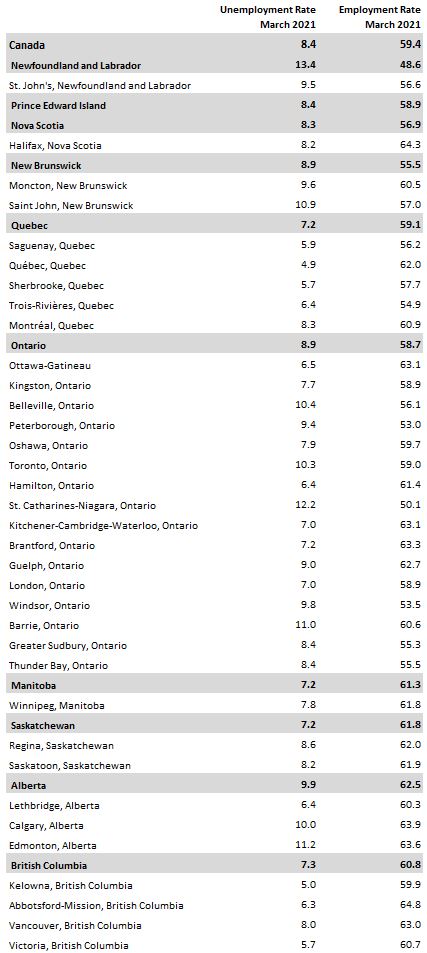
The unemployment rate for Halifax Census Metropolitan Area (CMA) in March 2021 was 8.2% (seasonally adjusted 3 month moving average). Quebec City at 4.9% had the lowest unemployment rate among CMAs while the highest was in St. Catharines-Niagara (12.2%).
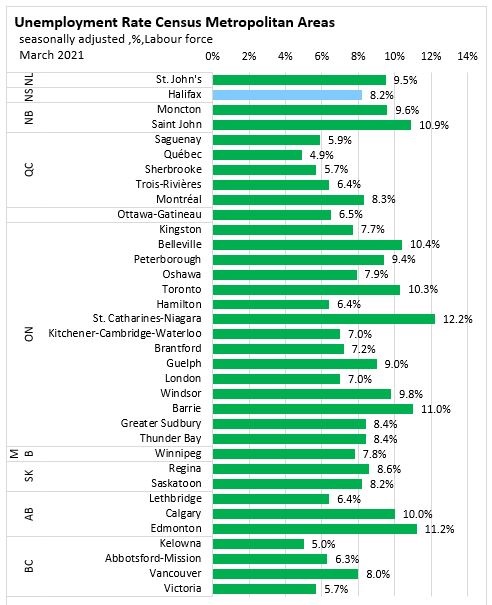
The seasonally adjusted employment rate for Halifax was 64.3%, up compared to last month and the second highest among CMAs this month. Abbotsford-Mission (64.8%) had the highest employment rate while St. Catharines-Niagara (50.1%) had the lowest among CMAs.

Halifax’s employment (3 month moving average) for March 2021 was up 1.0 % compared to the February 2021 result. The employment level (Jan-Mar) average compared to previous average (Dec-Feb) was up by the largest amount in Windsor (+5.2%) and decreased the most in Belleville (-4.4%).
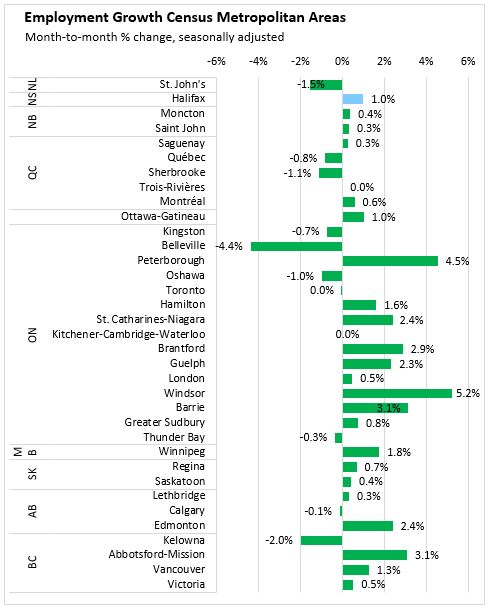
Note: Seasonally adjusted, 3 month average.
Sources:
Statistics Canada. Table 14-10-0287-01 Labour force characteristics, monthly, seasonally adjusted and trend-cycle, last 5 months
Statistics Canada. Table 14-10-0294-01 Labour force characteristics by census metropolitan area, three-month moving average, seasonally adjusted and unadjusted, last 5 months
Statistics Canada. Table 14-10-0293-01 Labour force characteristics by economic region, three-month moving average, unadjusted for seasonality, last 5 months
Statistics Canada. Table 14-10-0355-01 Employment by industry, monthly, seasonally adjusted and unadjusted, and trend-cycle, last 5 months (x 1,000)
Statistics Canada. Table 14-10-0288-01 Employment by class of worker, monthly, seasonally adjusted and unadjusted, last 5 months (x 1,000)
<--- Return to Archive