The Economics and Statistics Division maintains archives of previous publications for accountability purposes, but makes no updates to keep these documents current with the latest data revisions from Statistics Canada. As a result, information in older documents may not be accurate. Please exercise caution when referring to older documents. For the latest information and historical data, please contact the individual listed to the right.
<--- Return to Archive
For additional information relating to this article, please contact:
April 13, 2021UK TRADE BALANCE, FEBRUARY 2021
Month-over-month (Feb 2021 vs Jan 2021, seasonally adjusted )
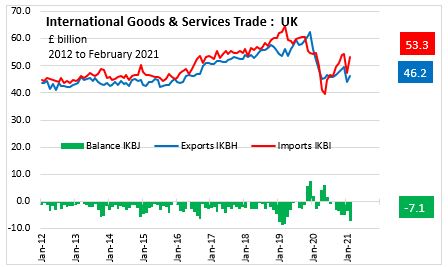
The United Kingdom goods and services balance of trade deficit widened by £3.8 billion to £7.1 billion. Exports of goods and services increased 5.4% (£2.3 billion) to £46.2 billion. Imports of goods and services increased 12.9% (£6.1 billion) to £53.3 billion.
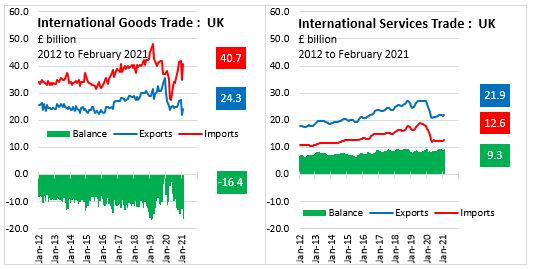
The United Kingdom goods balance of trade deficit widened by £3.9 billion to £16.4 billion. Exports of goods increased 9.9% (£2.2 billion) to £24.3 billion. Imports of goods increased 17.4% (£6.0 billion) to £40.7 billion.
The United Kingdom services balance of trade surplus widened by £97 million to £9.3 billion. Exports of services increased 0.8% (£168 million) to £21.9 billion. Imports of services increased 0.6% (£71 million) to £12.6 billion.
Year-over-year (Feb 2021 vs Feb 2020, seasonally adjusted )
The United Kingdom goods and services balance of trade deficit widened by £4.3 billion. Goods balance of trade deficit widened by £5.3 billion and services balance of trade surplus widened by £0.9 billion.
UNITED KINGDOM TRADING PARTNERS

Month-over-month (Feb 2021 vs Jan 2021, seasonally adjusted )
The United Kingdom EU goods balance of trade deficit narrowed by £2.4 billion to £5.7 billion. Exports of goods increased 46.6% (£3.7 billion) to £11.6 billion and imports of goods increased 7.8% (£1.3 billion) to £17.3 billion.
The United Kingdom non-EU goods balance of trade deficit widened by £6.3 billion to £10.7 billion. Exports of goods decreased 10.5% (£1.5 billion) to £12.7 billion and imports of goods increased 25.6% (£4.8 billion) to £23.4 billion.
Year-over-year (Feb 2021 vs Feb 2020, seasonally adjusted )
The United Kingdom EU goods balance of trade deficit narrowed by £0.4 billion and the United Kingdom non-EU goods balance of trade deficit widened by £5.7 billion.
UNITED KINGDOM GOODS TRADE BY SECTOR
NET TRADE: Year-to-date (Jan-Feb 2021)
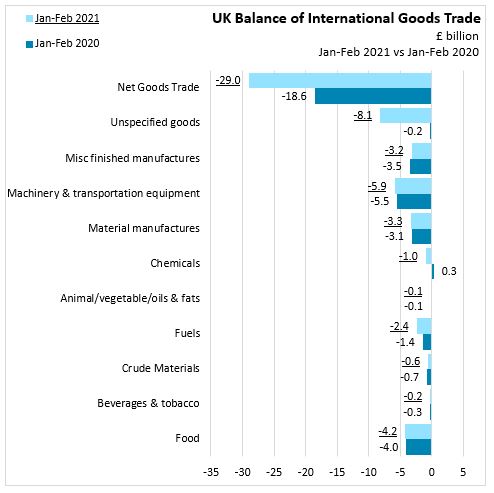
Net goods trade deficit increased £10,472 millions to -£29.0 billions.
- Animal/vegetable/oils & fats decreased £31 millions to -£0.1 billions.
- Beverages & tobacco increased £48 millions to -£0.2 billions.
- Crude materials increased £171 millions to -£.6 billions.
- Chemicals decreased £1,253 millions to -£1.0 billions.
- Fuels decreased £959 millions to -£2.4 billions.
- Miscellaneous finished manufactures increased £318 millions to -£3.2 billions.
- Material manufactures decreased £207 millions to -£3.3 billions.
- Food decreased £192 millions to -£4.2 billions.
- Machinery & transportation equipment decreased £438 millions to -£5.9 billions.
- Unspecified goods decreased £7,929 millions to -£8.1 billions.
EXPORTS: Year-to-date (Jan-Feb 2021)

Total Goods Exports decreased £10,942 millions to £46.3 billions.
- Machinery & transportation equipment decreased £4,167 millions to £17.9 billions.
- Chemicals decreased £934 millions to £7.8 billions.
- Miscellaneous finished manufactures decreased £1,463 millions to £7.1 billions.
- Material manufactures increased £102 millions to £5.4 billions.
- Fuels decreased £2,667 millions to £3.2 billions.
- Food decreased £707 millions to £1.8 billions.
- Crude Materials increased £422 millions to £1.5 billions.
- Beverages & tobacco decreased £34 millions to £1.2 billions.
- Unspecified goods decreased £1,473 millions to £0.4 billions.
- Animal/vegetable/oils & fats decreased £21 millions to £0.1 billions.
IMPORTS: Year-to-date (Jan-Feb 2021)

Total Goods Imports decreased £470 millions to £75.4 billions.
- Machinery & transportation equipment decreased £3,729 millions to £23.8 billions.
- Miscellaneous finished manufactures decreased £1,781 millions to £10.2 billions.
- Material manufactures increased £309 millions to £8.8 billions.
- Chemicals increased £319 millions to £8.7 billions.
- Unspecified goods increased £6,456 millions to £8.5 billions.
- Food decreased £515 millions to £6.0 billions.
- Fuels decreased £1,708 millions to £5.6 billions.
- Crude materials increased £251 millions to £2.1 billions.
- Beverages & tobacco decreased £82 millions to £1.4 billions.
- Animal/vegetable/oils & fats increased £10 millions to £0.2 billions.
REFERENCE
Office for National Statistics, Statistical Bulletin | Time Series | Time Series Explorer
<--- Return to Archive