The Economics and Statistics Division maintains archives of previous publications for accountability purposes, but makes no updates to keep these documents current with the latest data revisions from Statistics Canada. As a result, information in older documents may not be accurate. Please exercise caution when referring to older documents. For the latest information and historical data, please contact the individual listed to the right.
<--- Return to Archive
For additional information relating to this article, please contact:
May 10, 2021NON-PROFIT SECTOR EMPLOYMENT, 2019 Statistics Canada has released the human resources (employment and wage) module from the 2019 Non-Profit Sector Satellite Account. The non-profit sector includes:
- non-profit institutions serving households: community organizations
- business non-profit institutions: professional organizations including those reported within specific business sector industries
- government non-profit institutions: hospitals, nursing & residential care facilities, universities and colleges
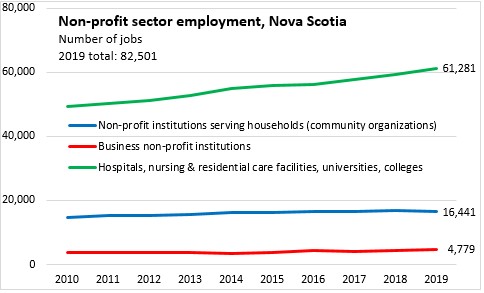
In 2019, there were 82,501 Nova Scotians who worked for organizations classified as non-profit institutions. The largest component of this employment was in the government sector (hospitals, nursing/residential care, universities, colleges), which also accounts for the bulk of employment growth in non-profit institutions.
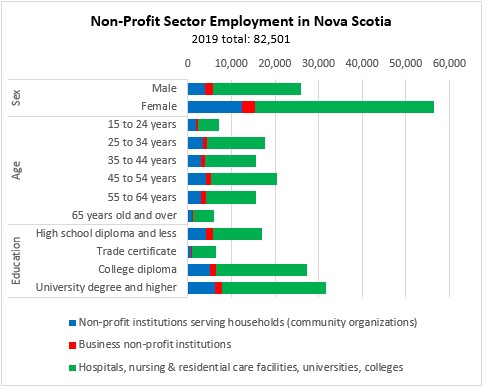
In 2019, women accounted for the bulk of non-profit institution employment in Nova Scotia. Those with university and college degrees made up over 71% of employment in non-profit institutions. The portion of university and college graduates was lower (61.7%) for business non-profit institutions. Employment by age cohort was generally consistent with each age cohort's share of the population with the exceptions of those aged 15-24 (disproportionately low employment in non-profit institutions) as well as those aged 45-54 and 65+ (disproportionately high employment in non-profit institutions).
Average annual wages and salaries for full time employees were were $47,452 in Nova Scotia's non-profit institutions. Full time wages and salaries were higher in business non-profit institutions as well as in hospitals, nursing and residential care facilities, universities and colleges.
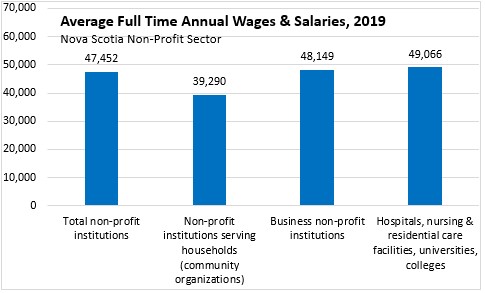
Nova Scotia non-profit institution wages and salaries for full time workers were below the national average across all types of institution. Nova Scotia wages and salaries for full time workers were third lowest for non-profit institutions serving households and business non-profit institutions. Nova Scotia wages and salaries for full time workers were second lowest for hospitals, nursing and residential care facilities, universities and colleges.

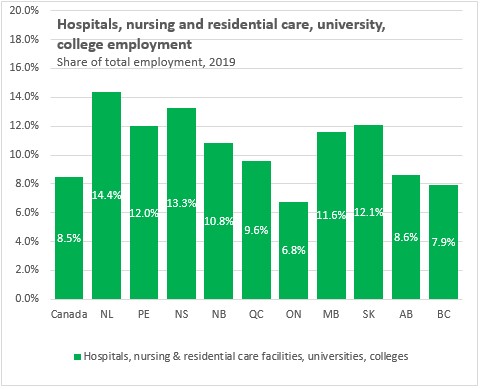
Nova Scotia's non-profit sectors accounted for 17.9% of total employment in 2019. The largest part of this was from hospitals, nursing and residential care facilities, universities and colleges.
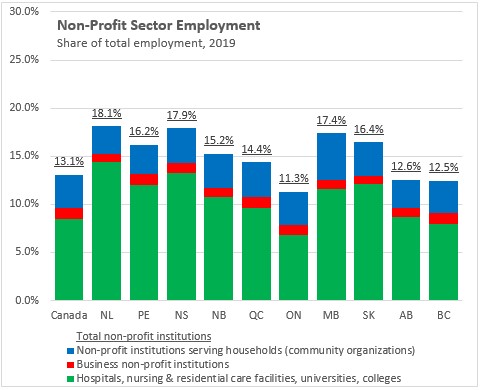
Hospitals, nursing and residential care facilities, universities and colleges accounted for 13.3% of Nova Scotia's total employment in 2019 - the second highest among provinces (after Newfoundland and Labrador). Hospitals, nursing and residential care facilities, universities and colleges accounted for 8.5% of national employment with higher shares in the Atlantic and prairie provinces and lower shares in Ontario and British Columbia.
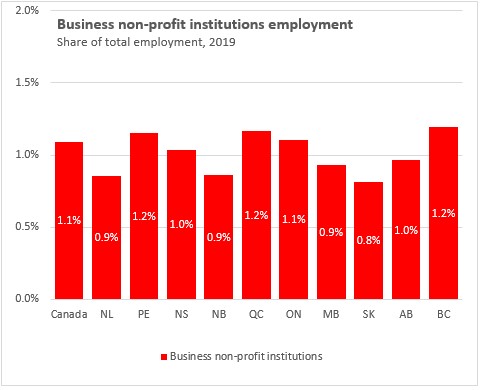
Business non-profit institutions amounted to 1.0% of Nova Scotia's employment in 2019 - just below the national average of 1.1%. Business non-profit institutions accounted for a higher share of employment in British Columbia and Quebec. Business non-profit institutions accounted for a lower share of employment in Saskatchewan.
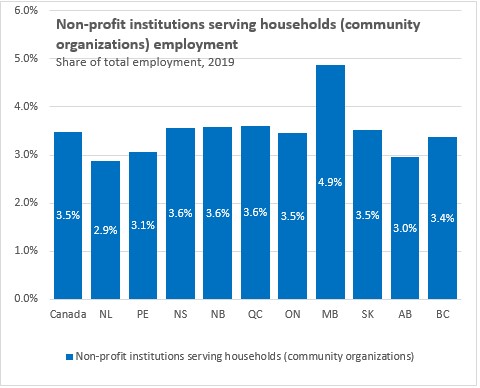
Employment in non-profit institutions serving households was 3.6% of Nova Scotia's total employment in 2019 - just above the national average of 3.5%. Non-profit institutions' share of employment was notably higfher in Manitoba and lower in Newfoundland and Labrador as well as Alberta.
Source: Statistics Canada. Table 36-10-0650-01 Employment in the non-profit sector by type of worker; Table 36-10-0650-01 Employment in the non-profit sector by type of worker; Table 14-10-0327-01 Labour force characteristics by sex and detailed age group, annual
<--- Return to Archive