The Economics and Statistics Division maintains archives of previous publications for accountability purposes, but makes no updates to keep these documents current with the latest data revisions from Statistics Canada. As a result, information in older documents may not be accurate. Please exercise caution when referring to older documents. For the latest information and historical data, please contact the individual listed to the right.
<--- Return to Archive
For additional information relating to this article, please contact:
May 28, 2021HOUSEHOLD ECONOMIC WELL-BEING DURING THE COVID-19 PANDEMIC, FOURTH QUARTER 2020 The quarterly distributions of household economic accounts estimates released today are experimental estimates of income, consumption, saving and wealth and their sub-components by various household distributions for 2020. The article below is based on averages at the household level. Note that difference calculations for "First quarter 2020/2019" and "First quarter 2020 - 2019" are based on quarterized values for 2019.
In the fourth quarter of 2020, household disposable income declined 2.0% compared to the previous quarter. The loss was apparent across income quintiles, with largest loss in percentage terms for the lowest income earners (-10.2%).
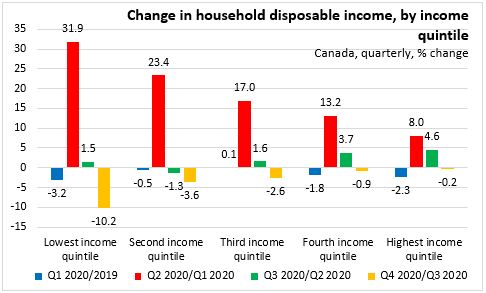
When looking across age groups, household disposable income declined the most in percentage terms for those aged 65 and over (-5.0%). Household disposable income increased 1.9% for those aged 35 to 44 years old.

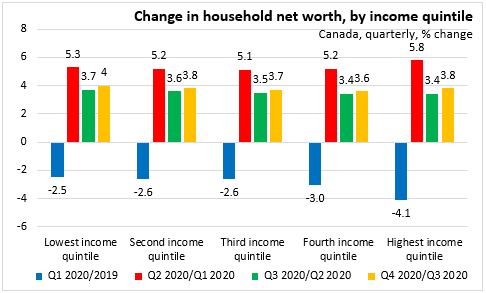
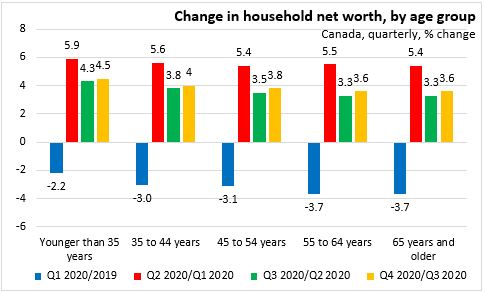
In 2020 Q4, net worth was up 3.7% for Canadian households. Each income quintile saw roughly the same growth over the period, with the largest increases in net worth in percentage terms were observed in the lowest income quintile (+4.0%) and those aged 35 and below (+4.5%). Wealth increased for these groups mainly due to consistently higher gains in real estate.
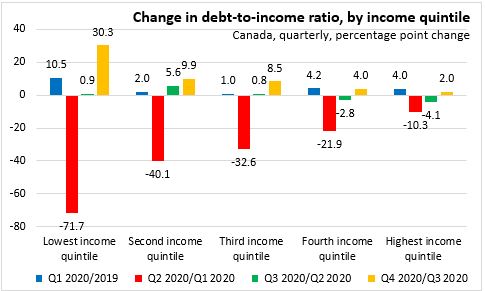
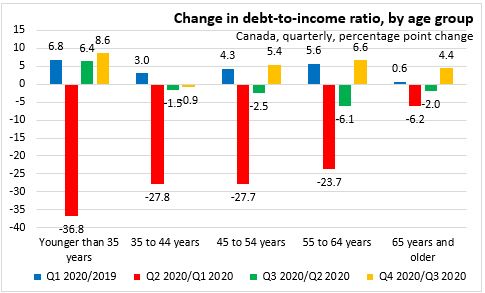
The household debt-to-income ratio increased 5.9 percentage points to 172.1% in the fourth quarter of 2020. The largest percentage point increase this quarter was for the lowest income quintile (+30.3% to 259.5%), who have seen the largest fluctuations in the debt-to-income ratio over 2020. The same can be said for those younger than 35 years old, who saw their household debt-to-income ratio increase 8.6 percentage points in the fourth quarter to 199.9%. Despite these increases, household debt-to-income ratios remain below pre-pandemic levels.
2020 with and without COVID-19 support measures
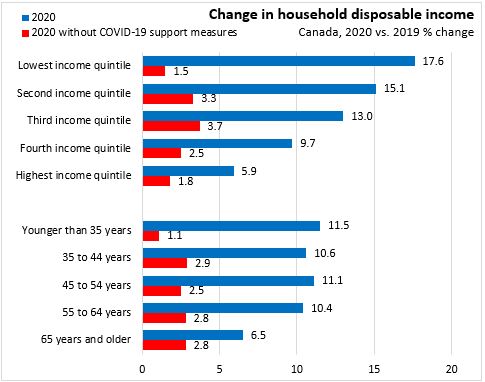
In 2020, household disposable income was up 10.0% with the largest gain for the lowest income earners at 17.6%. This was largely due to increases in government COVID-19 support measures. Excluding COVID-19 support measures, household disposable income for the lowest income quintile would have seen the slowest growth at 1.5%.
Household disposable income also grew the fastest for those younger than 35 years old (11.5%). Without COVID-19 support measures, household disposable income for those younger than 35 years old would have grown at only 1.1%.
Statistics Canada notes that COVID-19 support measures had a larger overall impact on the disposable income for the lowest-income and youngest earners, representing 9% and 14% of their total income in 2020, respectively. This analysis only estimates the direct impact of government transfers on household disposable income and does not take into consideration any indirect impacts that government support measures had on household economic or financial well-being.
As COVID-19 supports outpaced losses in employment income, the gap between the lowest- and highest-income households (measured by the difference between their respective shares of diaposable income) shrank by 1.9 percentage points in 2020.
Source: Statistics Canada, Household economic well-being during the COVID-19 pandemic, experimental estimates, fourth quarter 2020
<--- Return to Archive