The Economics and Statistics Division maintains archives of previous publications for accountability purposes, but makes no updates to keep these documents current with the latest data revisions from Statistics Canada. As a result, information in older documents may not be accurate. Please exercise caution when referring to older documents. For the latest information and historical data, please contact the individual listed to the right.
<--- Return to Archive
For additional information relating to this article, please contact:
September 15, 2021ANALYSIS OF NOVA SCOTIA'S CONSUMER PRICE INDEX FOR AUGUST 2021 TRENDS – August 2021
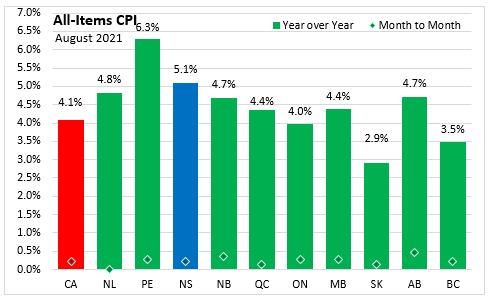
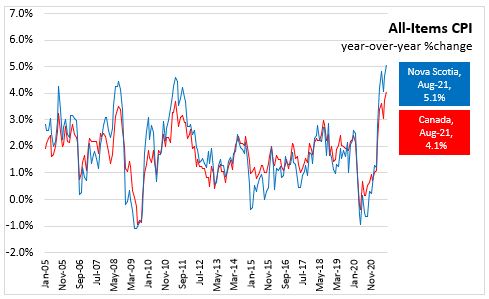
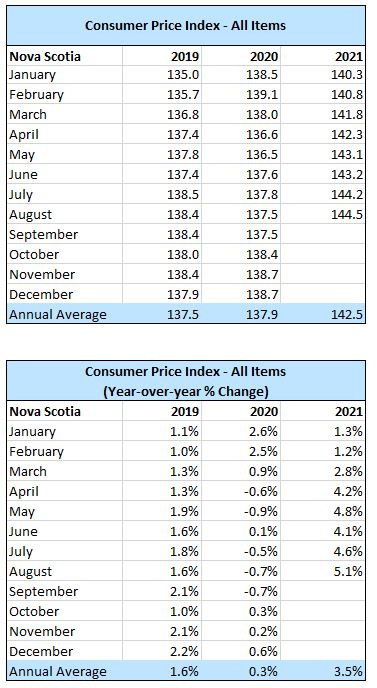
Nova Scotia’s All-Items Consumer Price Index (CPI) increased 5.1 year-over-year in August 2021, accelerating from the 4.6% increase in July. Nationally, consumer prices were up 4.1% from a year earlier, following a 3.7% increase in July 2021.
Statistics Canada noted that the national prices increase is mainly from accumulation of recent price pressures and lower prices in 2020. Durable goods prices rose 5.7% in August with passenger vehicles (+7.2%), furniture (+8.7%), and household appliances (+5.3%) contributing to the increase. Service prices (+2.7%) accelerated upwards for a fifth consecutive month as economies reopen. Traveller accommodation prices index rose 19.3% with accelerated prices in all provinces. Prices rose in seven of eight of the major components with consumers paying less for clothing and footwear compared to last year.
Transportation prices contributed the most to the overall increase with gasoline prices up 32.5% compared to August 2020 due to lower production compared to pre-pandemic levels, base-year effects, and suspended production with Hurricane Ida. Homeowners' replacement cost index, related to new home prices, with a 14.3% year-over-year increase was at it's largest increase since September 1987.
Impact of COVID-19 on the Consumer Price Index
Statistics Canada continued special CPI program measures for August 2021.As products become available for consumption again they are re-introduced into CPI calculation with an adjustment factor so that only that index's price movement impacts the calculation. (March 2021 Technical supplemental). For August 2021, travel tours and travel services to Asia are again available, so the August 2021 prices are compared with last observed prices in 2020 and the imputation made over the past year do not impact their re-introduction. Caution should be exercised with these indexes for 1-month change this month and 12-month changes for next year. Cruise-based travel tours are the only item with special treatment in August 2021.
All provinces had higher year-over-year inflation in August than July . Inflation was led by Prince Edward Island (+6.3%). Saskatchewan had the slowest growth (+2.9%).Compared to the previous month, all provinces except Newfoundland and Labrador had increases in the CPI index in August 2021.
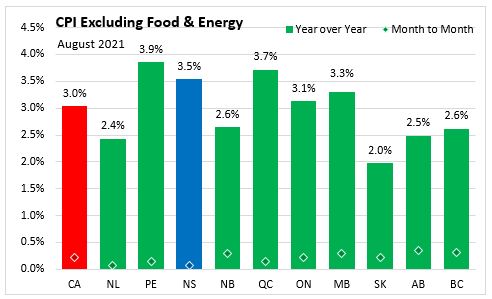
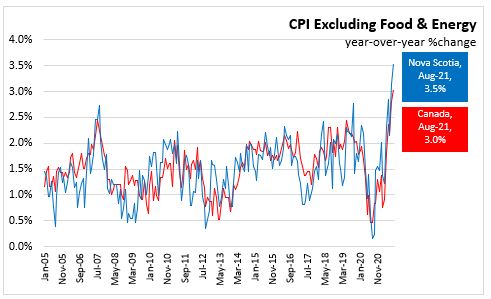
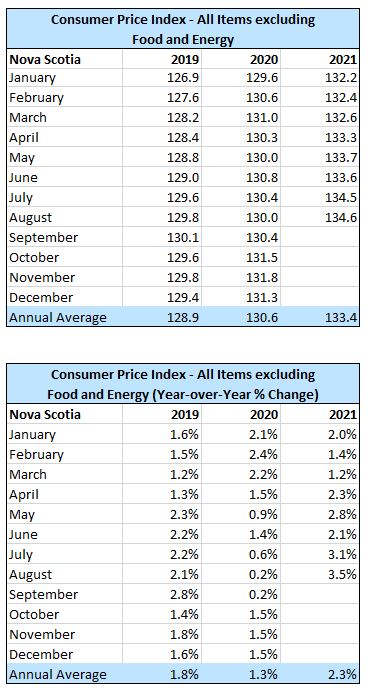
Nova Scotia’s consumer price inflation (year-over-year) excluding food and energy increased 3.5% in August 2021. Consumer prices excluding food and energy were up in all provinces led by Prince Edward Island (+3.9%) and Quebec (+3.7%). Saskatchewan had the smallest increase at 2.0%.
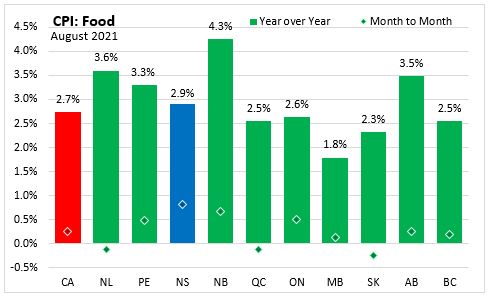
The CPI for food in Nova Scotia increased 2.9% year-over-year in August 2021. Nationally, food prices were up 2.7% from a year earlier. All provinces recorded year-over-year increase in food prices led by New Brunswick (+4.3%). Manitoba had the lowest increase at 1.8%.
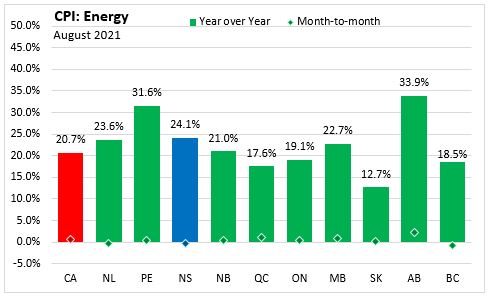
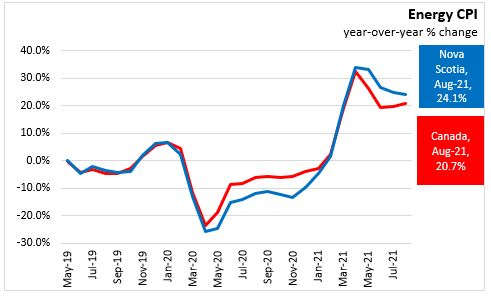
Nova Scotia energy prices increased 24.1% year-over-year in August 2021 compared to the national average of 20.7%. All provinces reported double digit increases in energy prices. The year-over-year change in Nova Scotia’s and other Atlantic provinces' energy CPI is more exposed to the effects of changes in oil prices on inflation due to a larger use of fuel as a source of home heating compared to other provinces.
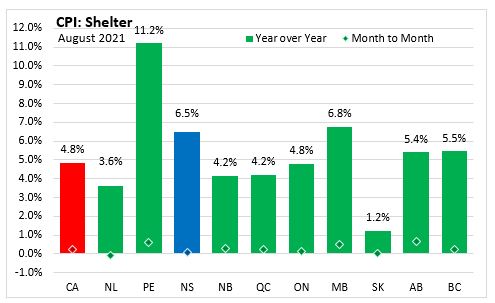
Year-over-year, shelter costs in Nova Scotia increased 6.5% in August 2021, above the national average increase of 4.8%. Compared to August 2020, shelter prices were up in all provinces with the largest increase in Prince Edward Island (+11.2%) and the smallest increase in Saskatchewan (+1.2%). Year-over-year rent prices slowed in Canada to a 1.6% increase in August compared to 2.6% for July. Nova Scotia was an exception to the slowing trend with rent prices rising 7.5% year-over-year in August compared with a 5.0% rise in July. New Brunswick (+8.7%) and Prince Edward Island (+7.9%) had similar rent price increases in August 2021. Nova Scotia's homeowners' replacement cost index was up 15.0%, also contributing to rise in year-over-year shelter prices.
Nova Scotia's consumer price inflation (year-over-year growth in CPI) excluding energy was 3.3% in August compared to a national rate of 3.0%. Prince Edward Island (+3.8%) posted the largest year-over-year gain while the CPI excluding energy had the smallest change in Saskatchewan (+2.0%).

Major Components for August 2021
The following table shows the price increases specific to Nova Scotia for the major components of the CPI this month:
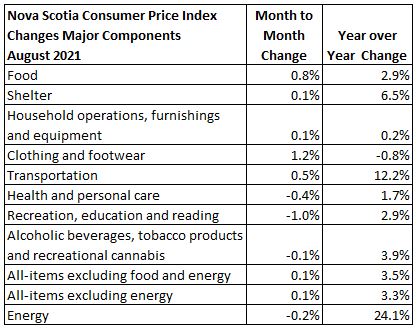
The main contributors to the monthly change (August 2021 vs July 2021) in Nova Scotia CPI were:
- Inter-city transportation (+31.6%)
- Traveller accommodation (+9.1%)
- clothing accessories, watches and jewellery (+7.3%)
- Travel tours (NA)
- Personal care supplies and equipment (-2.9%)
- Gasoline (-0.9%)
The main contributors to the yearly change (August 2021 vs August 2020) in Nova Scotia CPI were:
- Gasoline (+41.2%)
- Purchase and leasing of passenger vehicles (+7.6%)
- Fuel oil and other fuels (+33.7%)
- Telephone services (-14.9%)
- Mortgage interest cost (NA)
- Recreational equipment and services (excluding recreational vehicles) (-4.7%)
Long Run Trends
In August 2021, the All-Items CPI year-over-year inflation rate for Nova Scotia was 5.1%, above Canada's rate at 4.1%. Month-to-month movements in the indices can be different, but over time they generally follow the same overall trend. Nova Scotia’s all-items CPI increase of 5.1% in August 2021 was the largest increase since March 2003 (+6.9%).
Nova Scotia’s CPI excluding food and energy increase of 3.5%, increasing 0.4 percentage point from the 3.1% increase the previous month. Canada CPI excluding food and energy had a smaller increase rising from 2.8% to 3.0%.The NS CPI excluding food and energy was previously higher only in April 2003 (+4.1%).
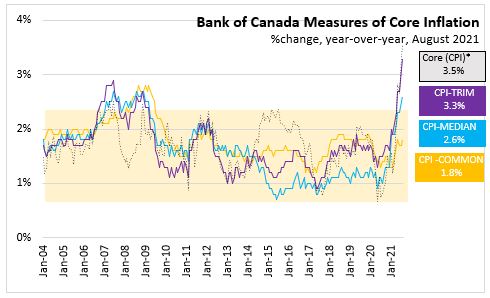
Bank of Canada's preferred measures of core inflation
Compared to August 2020, CPI-Common increased 1.8%, CPI-Median increased 2.6% and CPI-Trim was up 3.3% in Canada. All-items CPI excluding eight of the most volatile components as defined by the Bank of Canada and excluding the effect of changes in indirect taxes (formerly referred to as CPIX), rose 3.5% year-over-year. The change in the core inflation measures were up 0.1 percentage points for CPI-common, 0.1 percentage point for CPI-median and up 0.2 for CPI-trim.
Appendix Tables and Charts
Basket Update
With the June 2020 release the CPI basket of goods and services has been updated. The new basket weights are based on 2020 expenditure data, in which spending would reflect pre-pandemic patterns (Jan-Feb), an economy mostly in lockdown (March-June), and the emergence of new consumption patterns as economy re-opened (July-December). Statistics Canada notes that the "The data reflect shifts in spending due to the COVID-19 pandemic that will likely take some time to stabilize across goods and services, and geographic regions" and the June 2021 headline CPI for Canada would be the same if the previous basket weights (2017) were used. The weights for shelter (+2.86 percentage points), households operations, furnishings and equipment (+2.23 percentage points), and alcoholic beverages, tobacco products and recreational cannabis (+1.7 percentage points) are higher in the 2020 basket while transportation had the largest decline falling from a 19.72% share to 15.34% share. New products classes were added for shipping fees and local delivery fees (including restaurant and grocery delivery fees), digital subscriptions services to magazines, and video game consoles. Further information on the update can be found in An Analysis of the 2021 Consumer Price Index Basket Update, Based on 2020 Expenditures
Source: Statistics Canada. Table 18-10-0004-01 Consumer Price Index, monthly, not seasonally adjusted; Table 18-10-0256-01 Consumer Price Index (CPI) statistics, measures of core inflation and other related statistics - Bank of Canada definitions
<--- Return to Archive