The Economics and Statistics Division maintains archives of previous publications for accountability purposes, but makes no updates to keep these documents current with the latest data revisions from Statistics Canada. As a result, information in older documents may not be accurate. Please exercise caution when referring to older documents. For the latest information and historical data, please contact the individual listed to the right.
<--- Return to Archive
For additional information relating to this article, please contact:
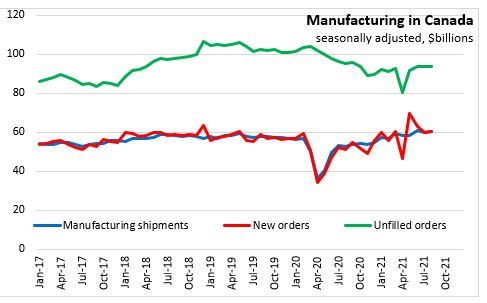
October 14, 2021MANUFACTURING SHIPMENTS, AUGUST 2021 With August reference month results, year-over-year (Aug2021 vs Aug2020) and year-to-date (Jan-Aug 21 vs Jan-Aug20) show rebounds in economic activity from the unprecedented declines observed in the first wave of the COVID-19 pandemic.
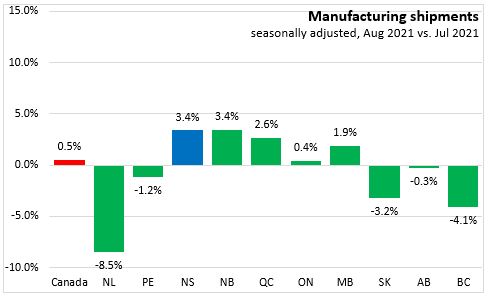
Month over month (seasonally adjusted, August vs. July 2021)
Nova Scotia's manufacturing shipments increased 3.4% to $842.4 million. National shipments increased 0.5% to $60.31 billion.
Manufacturing shipments were up in 5 of 10 provinces, led by New Brunswick and Nova Scotia. Newfoundland and Labrador and British Columbia reported the largest declines.
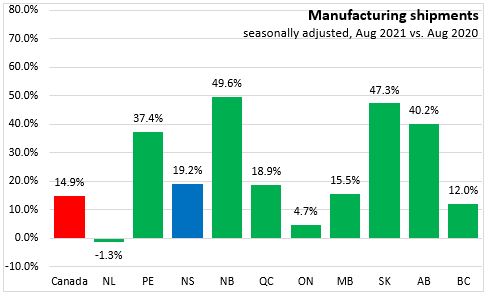
Year over year (seasonally adjusted, August 2021 vs. August 2020)
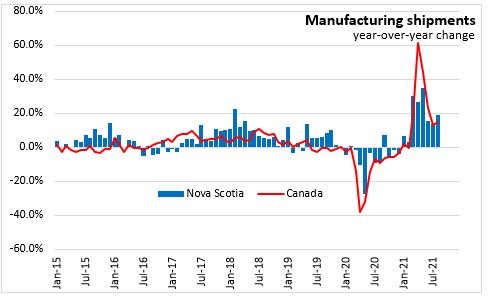
Nova Scotia's manufacturing shipments increased 19.2%. National shipments increased 14.9%.
Manufacturing shipments were up in 9 of 10 provinces, led by New Brunswick and Saskatchewan. Newfoundland and Labrador was the only province to report a decline.
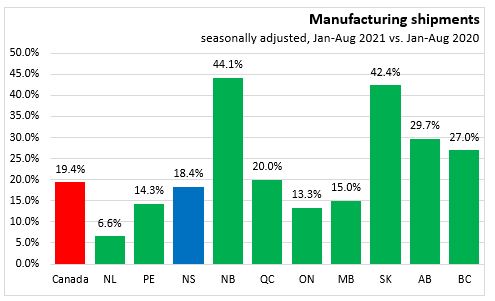
Year to date (seasonally adjusted, Jan-Aug 2021 vs. Jan-Aug 2020)
Nova Scotia's manufacturing shipments increased 18.4%. National shipments increased 19.4%.
Manufacturing shipments were up in all 10 provinces, led by New Brunswick and Saskatchewan. Newfoundland and Labrador reported the smallest gain.
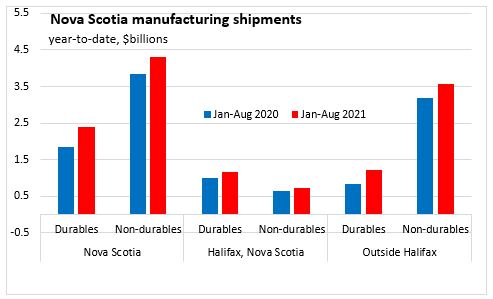
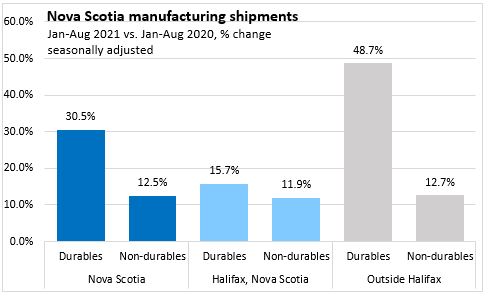
Nova Scotia's durable goods shipments increased 30.5%, while non-durable goods shipments increased 12.5%. In Halifax, durable goods shipments increased 15.7%, while non-durables increased 11.9%. Outside Halifax, durable goods shipments increased 48.7%, while non-durables increased 12.7%.
Trends
In the nine months leading up to the start of the COVID-19 pandemic, manufacturing shipments had been trending down both in Canada and in Nova Scotia.
After the pandemic was declared, Nova Scotia's manufacturing shipments declined sharply, falling 16.1% from February 2020 to May 2020.
National shipments reached their trough earlier, falling 36.3% from February 2020 to April 2020.
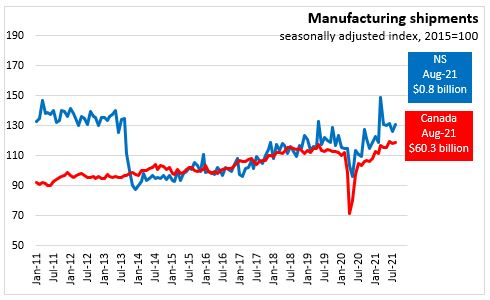
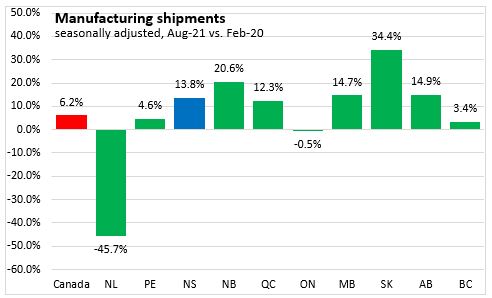
Since then, Nova Scotia's manufacturing shipments have recovered and were 13.8% higher in August 2021 than in February 2020. National shipments have also been trending upwards since August 2020 and were 6.2% higher in August 2021 when compared to February 2020 levels.
Statistics Canada. Table 16-10-0047-01 Manufacturers' sales, inventories, orders and inventory to sales ratios, by industry (dollars unless otherwise noted); Table 16-10-0048-01 Manufacturing sales by industry and province, monthly (dollars unless otherwise noted) (x 1,000); Table 16-10-0011-01 Manufacturing sales, by industry for 12 Selected Census Metropolitan Areas (x 1,000)
<--- Return to Archive