The Economics and Statistics Division maintains archives of previous publications for accountability purposes, but makes no updates to keep these documents current with the latest data revisions from Statistics Canada. As a result, information in older documents may not be accurate. Please exercise caution when referring to older documents. For the latest information and historical data, please contact the individual listed to the right.
<--- Return to Archive
For additional information relating to this article, please contact:
November 09, 2021PROVINCIAL ECONOMIC ACCOUNTS 2020 The Provincial Economic Accounts provide the official estimates of Nova Scotia's gross domestic product (GDP) and select indicators. The estimates released today include revisions for the years 2018 and 2019 and the first estimate of expenditure and income for 2020. Nova Scotia real GDP growth was revised up 0.1 percentage points to 1.9% in 2018 and 0.6 percentage point to 3.0% in 2019. Real GDP growth in 2019 was the fastest pace since 2002.
Declines in economic activity were widespread amid the COVID-19 pandemic. The scope, duration and impact of restrictions and disruptions varied by province. In general, most provinces had declines in household spending, exports, business investment with offsetting lower imports and increases in housing and government investment.
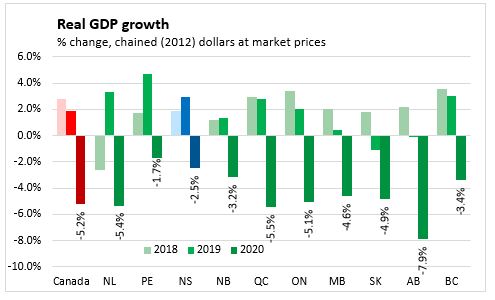
In 2020, real GDP decrease 5.2% in Canada with every province and territory except Yukon (+5.2%) and Nunavut (+2.6%) reporting declines. Prince Edward Island (-1.7%) reported the smallest decline among the provinces, followed by Nova Scotia (-2.5%). The largest decline in 2020 was in Alberta (-7.9%), followed by Quebec (-5.5%). Canada’s decline was the sharpest since 1961 when data was first recorded. Nova Scotia’s decline was largest on records back to 1981. Most provinces experienced their largest real GDP decline in 2020 with exception of Newfoundland and Labrador (2009), Saskatchewan (2009), and British Columbia (1982).
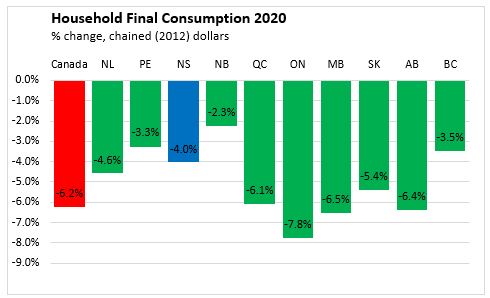
For Canada, household spending growth was down 6.2% in 2020. Real (adjusted for price changes) household consumption was down in all provinces in 2020. New Brunswick had the smallest decline at -2.3% and Ontario (-7.8%) had the largest decline. Nova Scotia real household consumption fell 4.0% in 2020.
Real government final consumption expenditures (all levels of government) was essentially unchanged (+0.0%) in Canada with increases in five provinces offset with declines in the other five provinces in 2020. Nova Scotia government final consumption expenditure increased 0.9%.

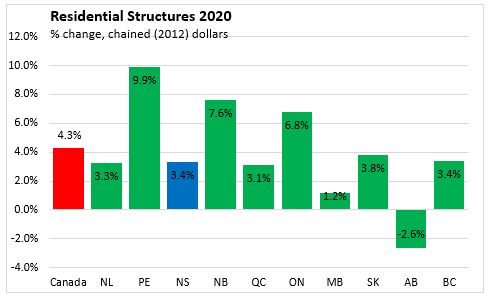
Residential expenditures were up 4.3% in with rising housing activity in all provinces except Alberta (-2.6%). The fastest growth was in Prince Edward Island (+9.9%). Nova Scotia residential structures investment was up 3.4% in real dollar terms.
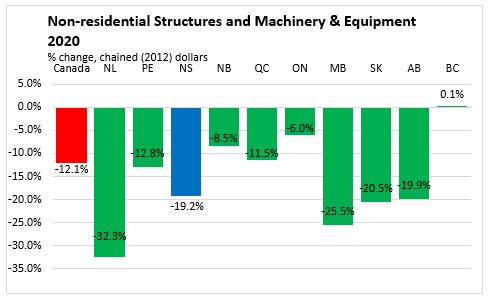
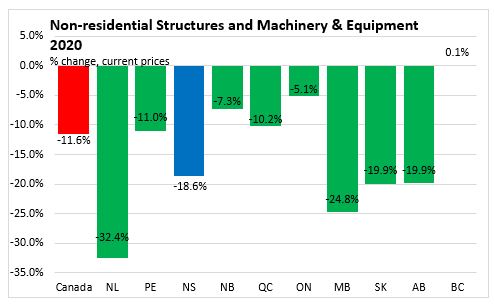
Non-residential structures and machinery and equipment investment declined 12.1% in Canada and 19.2% in Nova Scotia in 2020. British Columbia reported a 0.1% increase and the largest declines were in Newfoundland and Labrador (-32.3%) and Manitoba (-25.5%).
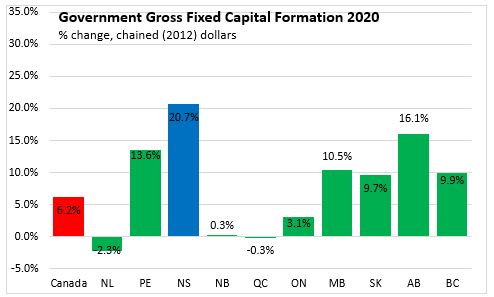
Government fixed capital formation was up 6.2% in Canada with increase in eight provinces and only modest declines in Newfoundland and Labrador (-2.3%) and Quebec (-0.3%). Nova Scotia (+20.7%) reported the largest increase.
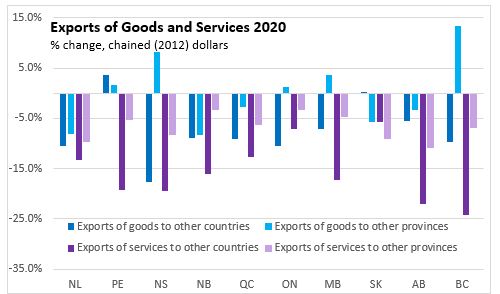
Exports of goods and services (including international and interprovincial destinations) declined in all provinces in 2020. Saskatchewan (-2.7%) and Prince Edward Island (-3.4%) reported the smallest decline. Newfoundland and Labrador (-10.3%) reported the largest decline in exports, followed by Nova Scotia and British Columbia (both -9.7%). Export of services to other countries and other provinces were both down in all provinces.


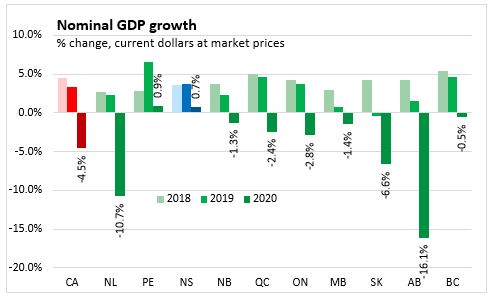
For 2020, nominal GDP (volumes and price change) declined 4.5% in Canada. GDP deflators were positive in seven provinces but declined for Newfoundland and Labrador, Saskatchewan and Alberta. Nominal GDP rose in Prince Edward Island (+0.9%) and Nova Scotia (+0.7%) in 2020. Alberta (-16.1%) reported the largest decline.
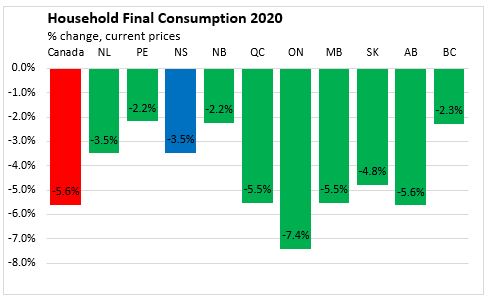
Nominal household consumption fell to a smaller degree than real consumption decline with overall positive inflation in 2020. Nova Scotia nominal household final consumption was down 3.5%, less than national decline of 5.6%. Prince Edward Island and New Brunswick (both -2.2%) had the smallest decline while Ontario (-7.4%) reported the largest decline.
Nominal General Government final consumption was up in all provinces except Alberta in 2020.

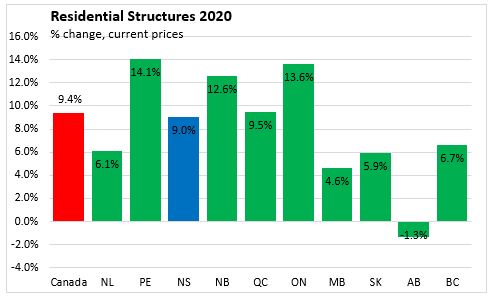
Nominal residential structures rose more than real residential structures in all provinces except Alberta (-1.3%) in 2020 reflecting higher prices for new housing, repair and renovations. Nova Scotia nominal residential investment was up 9.0%, slightly below national increase of 9.4%.
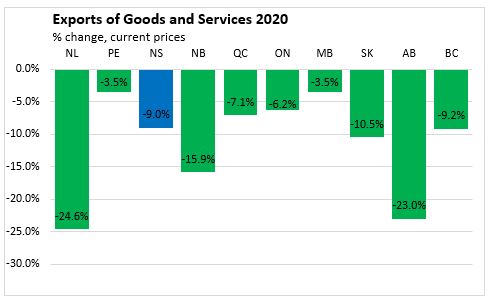
Nominal exports were down in all provinces with the largest declines in provinces were significant energy export sectors. Nova Scotia nominal exports fell 9.0% in 2020.
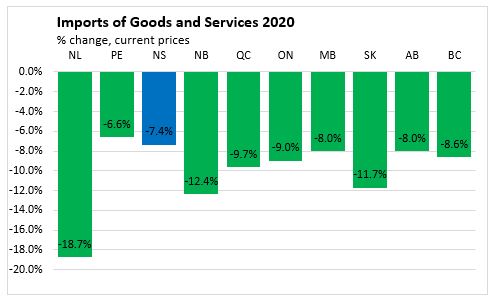
Nominal imports of goods and services decline in all provinces in 2020.
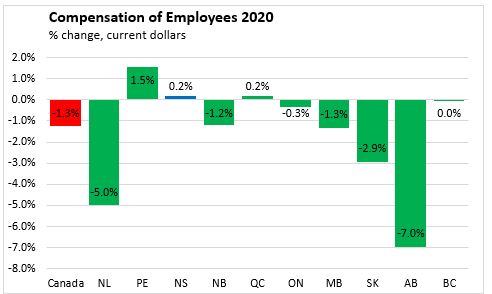
Employee compensation declined 1.3% in Canada in 2020. The largest declines were in Alberta (-7.0%) and Newfoundland and Labrador (-5.0%). Three provinces reported growth: Prince Edward Island (+1.5%), Nova Scotia (+0.2%) and Quebec (+0.2%).
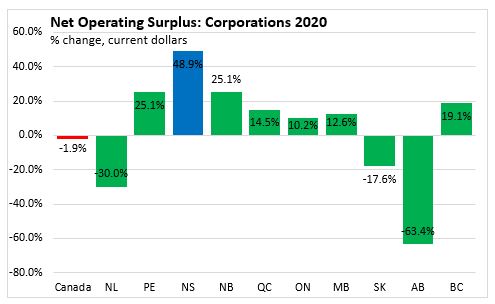
Net operating surplus of corporation increased in seven provinces in 2020. Nova Scotia (+48.9%) reported the largest increase in 2020. Lower corporate operating surpluses were reported in energy-producing provinces.
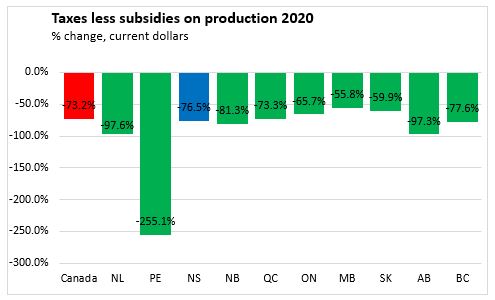
COVID-19 subsidies such as the Canada Emergency Wage Subsidy (CEWS) and the Canada Emergency Rent Subsidy (CERS) supported wages and business income in 2020 and get recorded as large declines in the taxes less subsidies on production accounts. All provinces reported declines of over 50% in taxes less subsides.
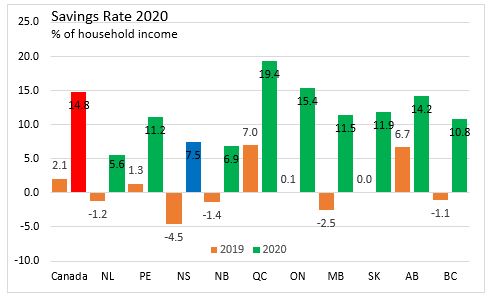
Overall household income grew by 5.6% nationally with the fastest growth in British Columbia (+7.0%). The smallest growth was in Alberta (+1.4%) and Newfoundland and Labrador (+1.9%). Nova Scotia household income increased 6.1% in 2020.

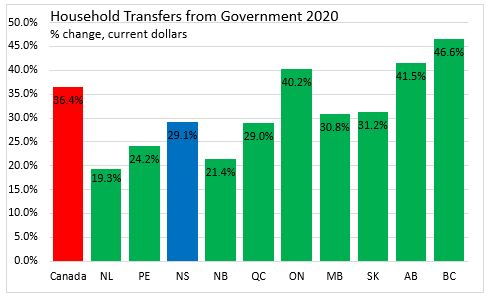
Driving the increases in household income across the provinces in 2020 was additional government transfers to households related to COVID-19 support programs such as
Canada Emergency Response Benefit (CERB) and Canada Recovery Benefit (CRB). Total government transfers to households increased $119.7 billion in Canada or by 36.4%. Government transfers to Nova Scotia households increased by $2.647 billion (+29.1%) to $9.502 billion.
With raising household income and decreased spending in all provinces, household savings rates increased significantly across the country. Nova Scotia went from a negative savings rate of 4.5% in 2019 to saving 7.5% of household income in 2020. Quebec reported the highest savings rate at 19.4% in 2020.
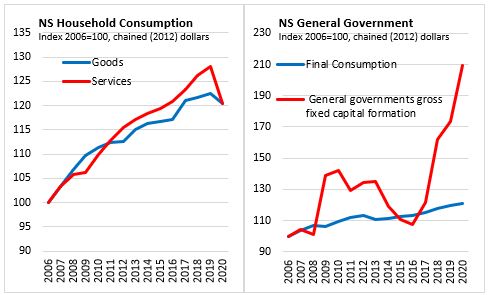
The Nova Scotia economy has grown for six consecutive years prior to 2020

Real household consumption decreased 4.0% in 2020 with declines in goods (-1.7%) and services (-6.1%). All categories of goods purchases declined: durable (-3.4%), semi-durable (-4.2%) and non-durable (-0.4%). Governmental final consumption expenditures rose 0.9%, a slower pace than previous three years. Government gross fixed capital formation rose 20.7% in 2020 following on increases of 7.2% in 2019, 32.7% in 2018 and 13.6% in 2017.
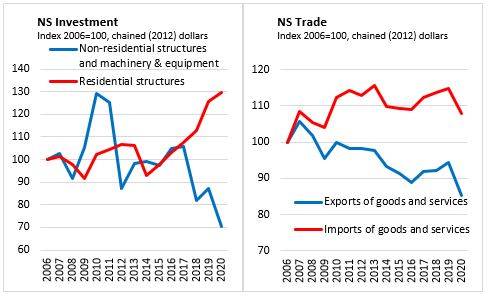
Residential structures growth continued its upward trend in 2020 with a 3.4% increase. Residential structures have increased for six consecutive years, rising at an average 5.8% per year pace since 2014.
Non-residential structures (-17.6%), machinery and equipment (-20.5%), and intellectual property products (-2.0%) all declined in 2020
The volume of exports was down 9.7% in 2020. International exports experienced large declines with international goods shipments down 18.2% and export of services to other countries falling -17.6%. Export to other provinces declined 0.8% as interprovincial goods shipments rose 8.2% to nearly offset the 8.2% decline in service exports to other provinces.
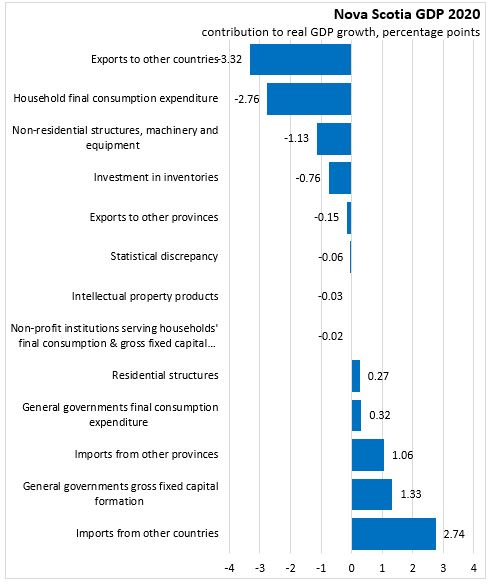
For 2020, the largest contributions to the GDP decline were form exports to other countries (-3.32 percentage points), household final consumption (-2.76 percentage points), business investment fixed capital (-1.13 percentage points), and inventories drawdown (-0.76 percentage points). Growth in government fixed capital formation (+1.33 percentage points), government final consumption expenditure (+0.32 percentage points) and residential structures (+0.27 percentage points) made positive contributions.
Imports from other provinces (+1.06 percentage points) and other countries (+2.74 percentage points) make a positive contribution in the real GDP calculation as their decline needs to be removed to avoid double counting decreases in other areas (household consumption, investment, and exports).
Source: Statistics Canada. Provincial and territorial economic accounts, 2020
Table 36-10-0221-01 Gross domestic product, income-based, provincial and territorial, annual (x 1,000,000)
Table 36-10-0222-01 Gross domestic product, expenditure-based, provincial and territorial, annual (x 1,000,000)
<--- Return to Archive