The Economics and Statistics Division maintains archives of previous publications for accountability purposes, but makes no updates to keep these documents current with the latest data revisions from Statistics Canada. As a result, information in older documents may not be accurate. Please exercise caution when referring to older documents. For the latest information and historical data, please contact the individual listed to the right.
<--- Return to Archive
For additional information relating to this article, please contact:
November 12, 2021HIGH INCOME TRENDS AND EFFECTIVE TAX RATES, 2019 Statistics Canada has released the latest data for high income earners as well as effective income tax (Federal income, Provincial income, Federal payroll) and cash transfer rates (Federal and Provincial cash transfers). The latest data are from the 2019 taxation year.
High income earners
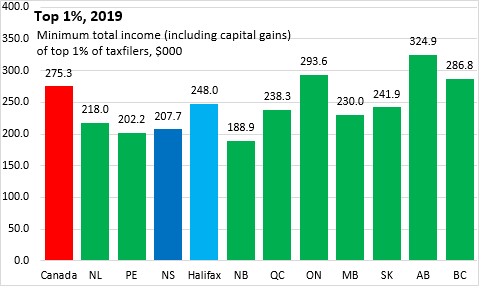
The threshold for the top 1 per cent of tax filers varies from Province to Province and from City to City. In Canada, those reporting total income (including capital gains) over $275,300 in 2019 represented the top 1 per cent of taxfilers. In Nova Scotia, there are fewer individuals with higher incomes and the threshold of the top 1 per cent was $207,700. In Halifax, the threshold of the top 1 per cent of earners was $248,000.
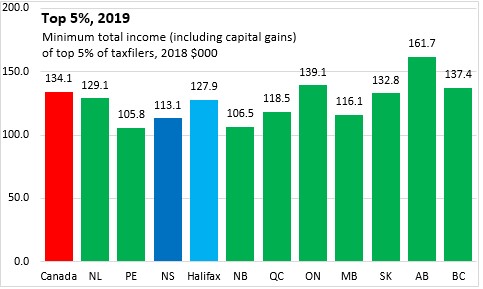
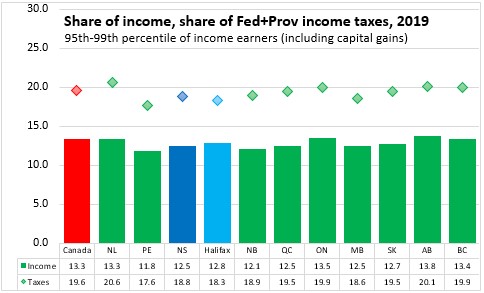
The top 5% of Canadian taxfilers had total income (including capital gains) of $134,100. In Nova Scotia, the top 5% of taxfilers had income of at least $113,100. Halifax's top 5% of taxfilers had incomes of at least $127,900.
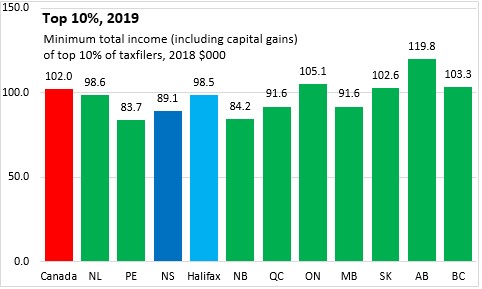
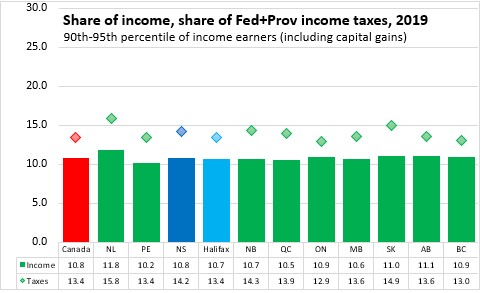
The top 10% of taxfilers in Canada had total income (including capital gains) of $102,000. For Nova Scotia, the top 10% of taxfilers had income of $89,100 or more; for Halifax the top 10% of taxfilers had income of $98,500.
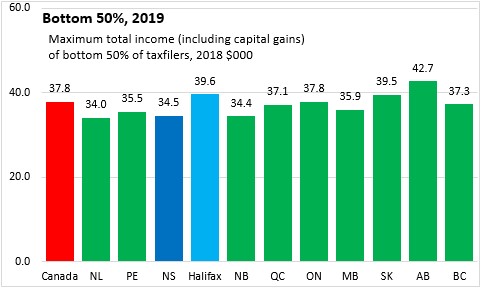
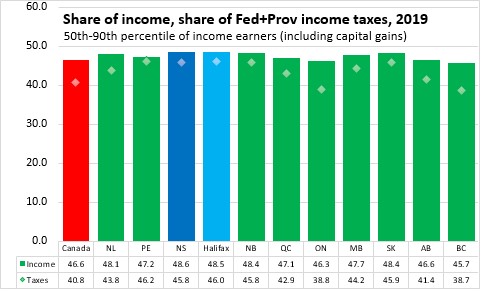
The upper threshold of income for the bottom 50% of taxfilers was $37,800 in Canada. It was $34,500 in Nova Scotia and $39,600 in Halifax.

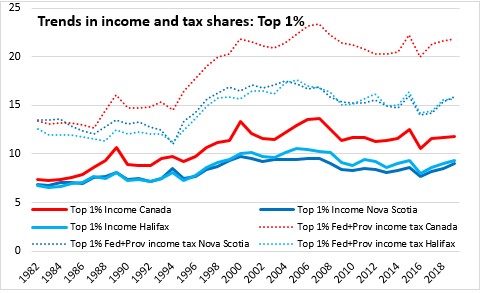
The top 1% of earners in Canada accounted for 11.8% of the total income (including capital gains) reported in 2019. In comparison, the bottom 50% of taxfilers accounted for 17.5% of total income.
In Nova Scotia, the top 1% reported a lower share of total income than the national average: 9.0%, while the bottom 50 per cent received a higher share of total income than the national average: 19.1%. Across Provinces, there is some variation in the share of total income accounted for by the top 1% of filers - with the highest shares reported in Ontario and British Columbia (note that each province has a different threshold that defines the top 1 per cent).
In general, those with the highest income bear a larger portion of Federal and Provincial income taxes than their shares of income. Across Canada, those in the 50th through 90th percentiles of income earners (including capital gains) pay a somewhat lower portion of combined Federal and Provincial income taxes than their share of income. Those in the bottom 50% of taxfilers earned a disproportionately lower portion of total income, but paid an even lower share of combined Federal and Provincial taxes.

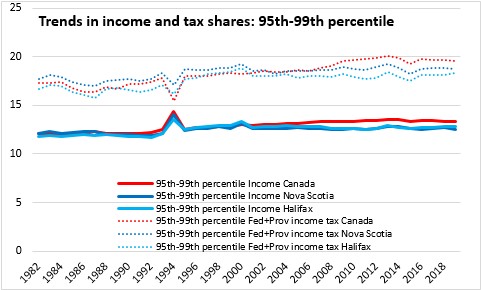
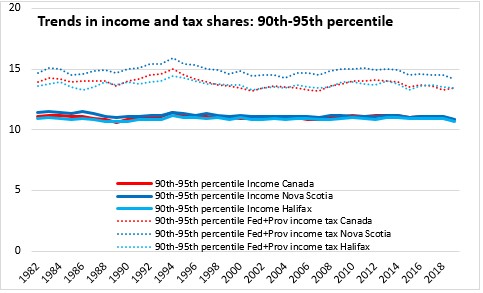
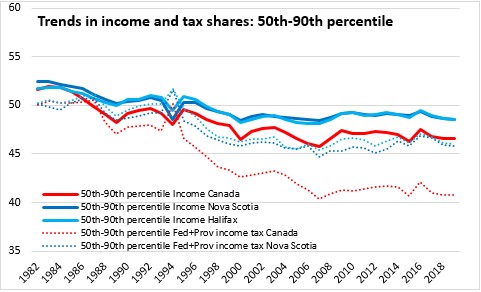
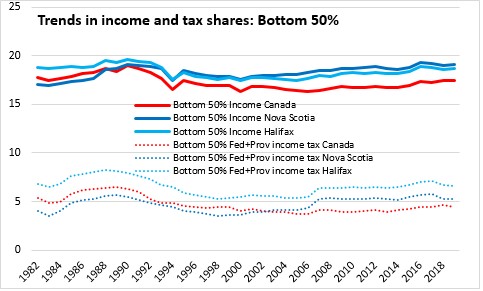
Over the period 1982-2019, the share of income accruing to the highest earners (top 1%, 95-99th percentile) has risen, though the portion of Federal and Provincial income taxes paid by these groups has risen even faster. The share of income accruing to the 90-95th percentiles of earners has been relatively stable while the share of taxes paid by this group has declined at both a national and provincial level. The share of incomes for the 50-90th percentiles has declined over the 1982-2019 period, but the share of taxes paid by these groups has fallen faster. In Nova Scotia, the share of income earned by the bottom 50% of taxfilers has risen over the last 20 years, but remains below levels reported in the late 1980s. The national share of income among the bottom 50% of taxfilers has risen more slowly after declining through the 1990s.
Note: Total income consists of income from earnings, investments, pensions, spousal support payments and other taxable income plus government transfers and refundable tax credits. Federal Income taxes are derived from line 420 of the federal income tax return and exclude the Quebec abatement.
Effective tax and transfer rates
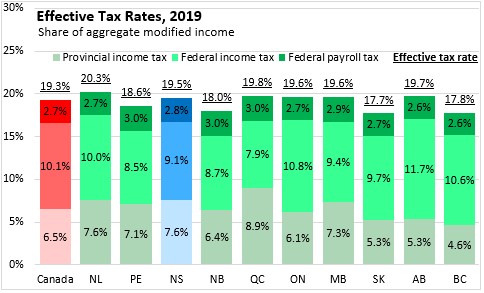
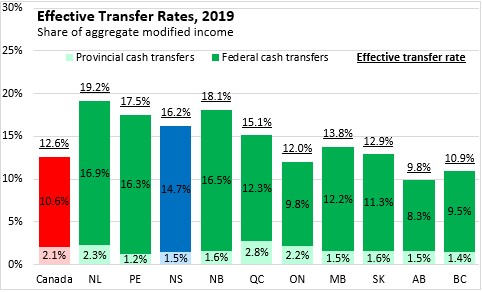
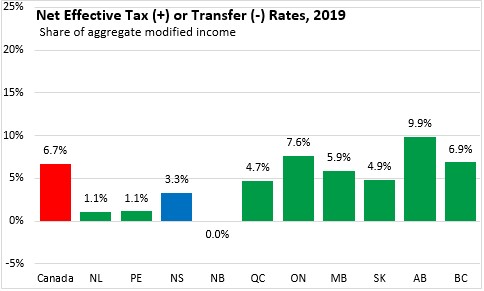
Statistics Canada's review of income trends also provides effective tax rates and transfer rates. Tax rates measure the sum of Federal income tax, Provincial income tax and Federal payroll taxes as a share of modified total income. Transfer rates measure the sum of Federal cash transfers plus Provincial cash transfers as a share of modified total income. In the analysis below, those that report taxes in excess of transfers pay a positive net tax rate while those whose transfers exceed their taxes report a negative net tax rate.
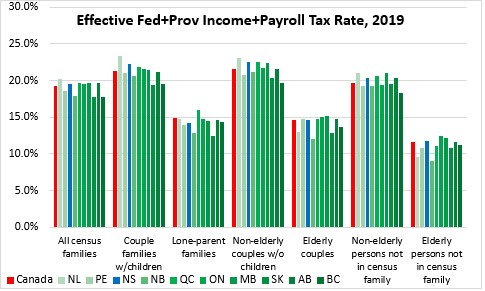
Across Canada, the effective tax rate was 19.3%. Nova Scotia's effective tax rate was just above this at 19.5%. The highest effective tax rates were reported in Newfoundland and Labrador while the lowest were reported in Saskatchewan and British Columbia.
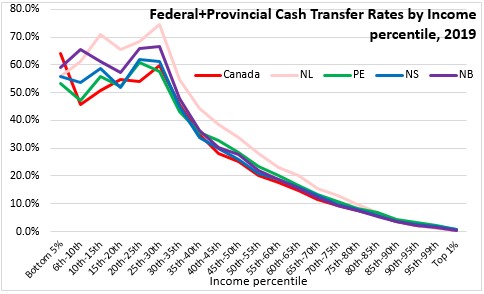
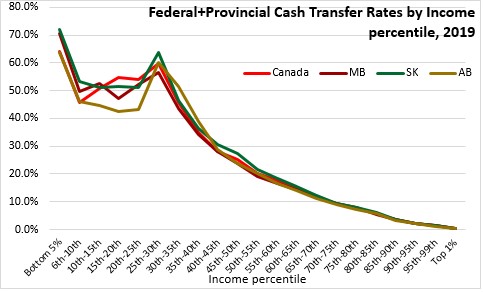
Transfer rates were also highest in Newfoundland and Labrador while the lowest rate of transfers was reported in Alberta. Nova Scotia's transfer rate was 16.2% of modified total income while the national average was 12.6%.
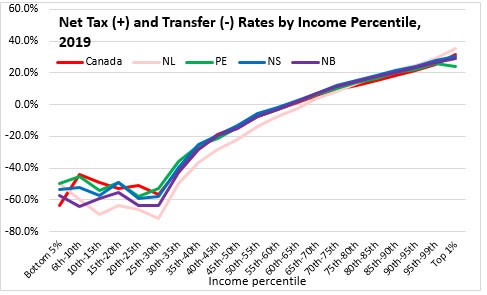
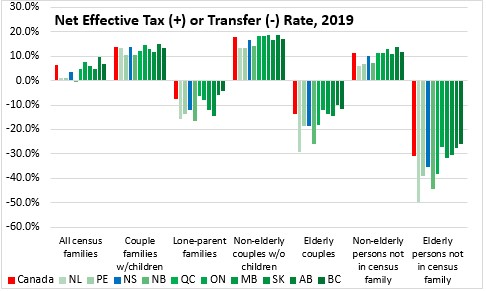
Nova Scotia's net effective tax rate (taxes less transfers) was 3.3% of total income. Nationally, the net effective tax rate was 6.7%. The highest net tax rates were reported in Alberta and the lowest were reported in New Brunswick.
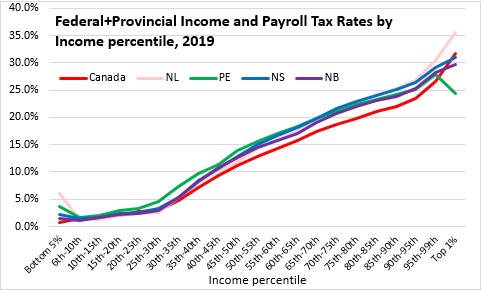
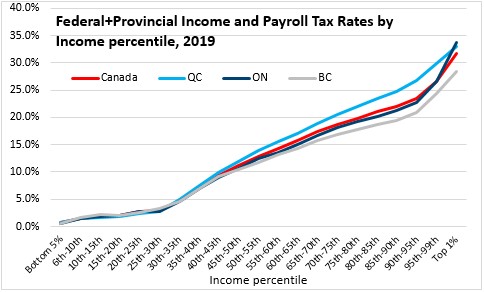
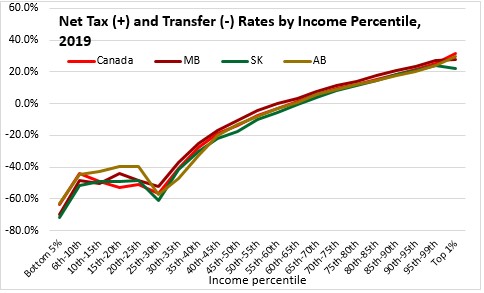
Canada's progressive tax rate structure generates higher tax rates (>25%) on those at the top end of the income distribution while tax rates for the lowest earners were typically under 5%. (Rates for the top 1% represent a smaller population and may be subject to more variability). Tax rates generally remained low for the bottom 25-30% of the income distribution before rising progressively for higher earners.

Cash transfer rates were notably higher for those in the bottom 25-30% of the income distribution. Transfer rates declined for higher earners.

Net tax rates were negative (meaning more transfers received than taxes paid) for about the bottom 55-65% of the income distribution. Those in the bottom 25-30% of the income distribution had notably lower net tax rates.

Canada's system of taxes and transfers make different provisions for certain family types and age cohorts. Tax rates were higher for non-elderly couple families and non-elderly persons not in a census family. There were lower effective tax rates for lone-parent families and elderly persons (whether in couples or not in census families).
Transfers were notably higher for elderly persons (reflecting public pension systems) as well as for lone-parent families. Other parents and non-elderly persons received much lower transfers as a share of income.

With higher transfer rates and lower tax rates, transfers exceeded taxes for the elderly as well as for long parents. The highest net taxes were paid by non-elderly couples without children.
Source: Statistics Canada. Table 11-10-0054-01 Federal and provincial individual effective tax rates; Table 11-10-0056-01 High income tax filers in Canada, specific geographic area thresholds
<--- Return to Archive