The Economics and Statistics Division maintains archives of previous publications for accountability purposes, but makes no updates to keep these documents current with the latest data revisions from Statistics Canada. As a result, information in older documents may not be accurate. Please exercise caution when referring to older documents. For the latest information and historical data, please contact the individual listed to the right.
<--- Return to Archive
For additional information relating to this article, please contact:
November 26, 2021FUNCTIONS OF GOVERNMENT, 2020 Statistics Canada has published details from Consolidated Government Finance Statistics for 2020 including consolidated results for provincial-territorial and local governments by nine functional areas of expenditure: health care, education, social protection, general public service (which includes debt payments), economic affairs (which includes transportation), public order/safety, environmental protection, housing/community amenities and recreation/culture. Details on defence spending are provided only at the Federal level. Annual data correspond to the end of the fiscal year closest to December 31. For example, data for the fiscal year ending on March 31, 2021 (fiscal year 2020-21) are reported as the 2020 reference year. Per capita expenditures are calculated using the population as of July 1 during the fiscal year; for fiscal year 2020-21, per capita expenditures are calculated using the population as of July 1, 2020
These data are based on the international government financial statistical standard and, as such, may differ in their presentation from similar concepts reported in Public Accounts and other financial statements. Statistics Canada's data allows for comparability across jurisdictions.
Total per capita expenditures by provincial-local government function added up to $14,832 in Nova Scotia, $1,001 per capita below the provincial-local government average in 2020 ($15,833). The largest categories of expenditure were: health, education, general public services (including debt service costs), social protection and economic affairs (including transportation). Quebec, Newfoundland and Labrador and Saskatchewan reported the highest per capita expenditures while the lowest were observed in Prince Edward Island.
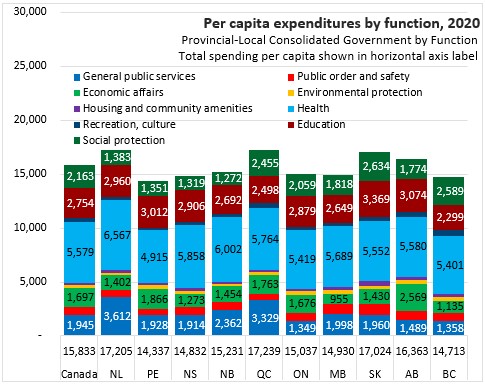
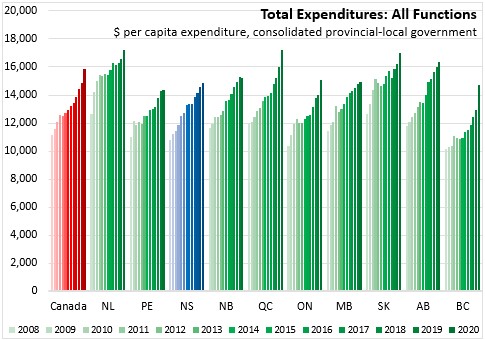
In the last year, Nova Scotia's per capita consolidated expenditures on provincial-local government functions increased by $306 per capita or 2.1%. National expenditures increased by $1,017 per capita or 6.9%. The fastest growth was in British Columbia (+13.7% or +$1,767 per capita) while New Brunswick (-0.2% or -$24 per capita) was the only province to report lower per capita spending.
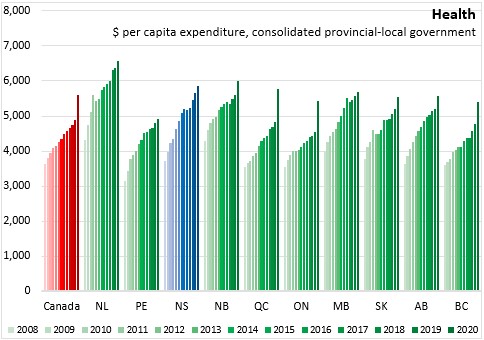
Health care makes up the largest per capita expenditure function in every provincial-local government. Nova Scotia's health expenditures of $5,858 per capita are above the national average of $5,579 per capita. Hospitals and outpatient services make up the bulk of health care spending. Nova Scotia's per capita expenditures are higher than average for hospitals ($4,283) and public health ($450 per capita) but lower for outpatient services ($597 per capita). The highest health expenditures were reported in Newfoundland and Labrador while the lowest were reported in Prince Edward Island.

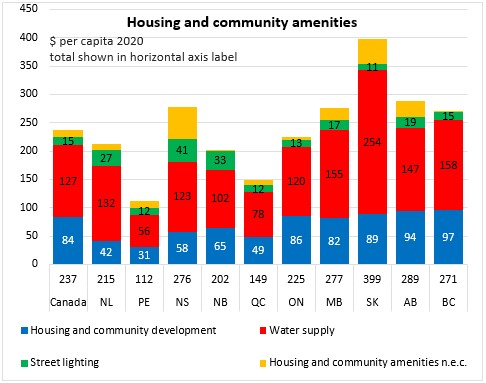
Note: n.e.c. refers to expenditures "not elsewhere classified".
Although health care expenditures have been increasing for many years, health care expenditures grew rapidly across most provinces in 2020. National per ccapita health expenditures increased by $710 per capita or 14.6% from 2019 to 2020. In Nova Scotia, health care expenditures increased by $213 per capita or 3.8%. The fastest growth in health expenditures were reported in Quebec (+19.2% or +$927 per capita) and Ontario (+19.0% or +$864 per capita). Saskatchewan (+2.2% or +$121 per capita) and Prince Edward Island (+2.4% or +113 per capita) reported the least growth in health expenditures.
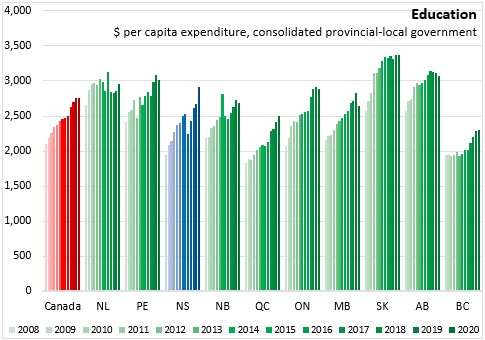
Education is the second largest functional expenditure made by provincial-local governments. Nova Scotia's education spending of $2,906 per capita is higher than the national average among provincial-local governments ($2,754). Nova Scotia's higher spending on education is attributable to universities ($906 per capita), which were were the highest among provinces. Nova Scotia's expenditures for primary/secondary education ($1,737 per capita) and colleges ($236 per capita) were below the national per capita average. Per capita education spending was highest in Saskatchewan and lowest in British Columbia.
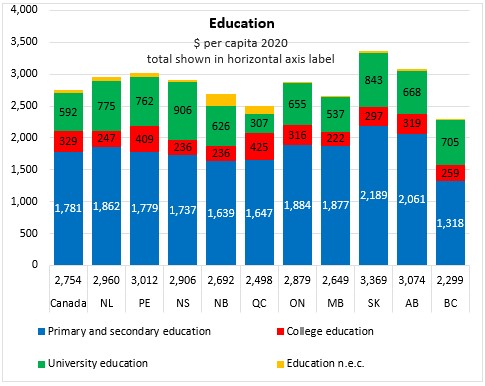
Nova Scotia reported the largest increase among province-local governments in consolidated per capita expenditures on education (+8.9% or +$237 per capita from 2019 to 2020). National education expenditures increased by just 0.2% ($5 per capita) with declines reported in Saskatchewan, Ontario, Alberta, New Brunswick, Prince Edward Island and Manitoba (the largest decline at -6.5% or -$183 per capita).
Provincial-local government consolidated expenditures on social protection amounted to $1,319 per capita in Nova Scotia - lower than the national average of $2,163 per capita. Expenditures on social protection exhibit a wide variation across Canada, with over $1,300 per capita difference from the lowest spending provincial-local government (New Brunswick) to the highest (Saskatchewan). Some of this variation is explained by markedly different service levels across provinces; Saskatchewan's higher payments for sickness and disability is attributable to benefits provided under that province's public auto insurance program.
Sickness/disability payments make up the largest portion of social protection expenditures in most jurisdictions, followed in some by children/family services and in others by expenditures to address social exclusion (including funding for low-income earners, refugees and homeless persons). Nova Scotia's expenditures on sickness/disability ($503 per capita), family/children ($224 per capita) and housing ($157 per capita) were all below the national averages. Nova Scotia's per capita expenditures on social exclusion were $432 per capita - above the national average of $409.
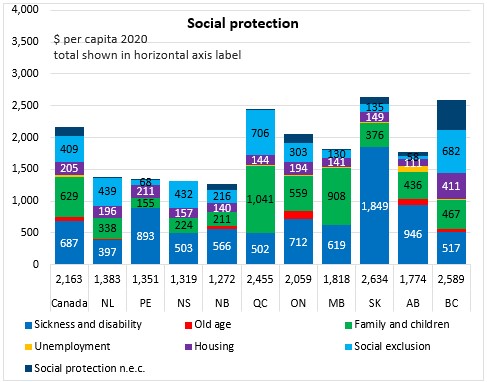
Consolidated provincial-local expenditures on social protection decreased by 3.4% (-$46 per capita) in Nova Scotia from 2019 to 2020. National expenditures increased by 8.0% (+$161 per capita) with the largest gain in British Columbia (+46.8% or +$826 per capita) and the largest decline in New Brunswick (-22.2% or -$363 per capita).

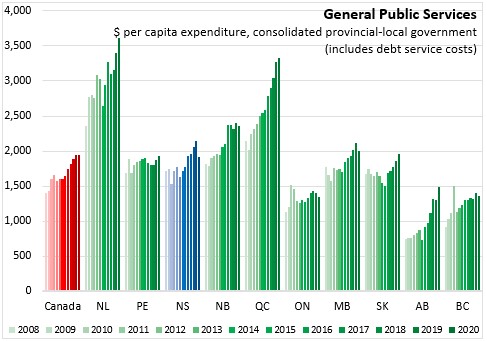
General public service expenditures (consolidated provincial-local) were $1,914 per capita in Nova Scotia, including $935 per capita in public debt transactions, $554 per capita in general provincial-local government services and $324 per capita in executive/legislative/financial/fiscal affairs. Nova Scotia's general public service expenditures are below the national per capita average. The highest expenditures on general public services were in Newfoundland and Labrador as well as Quebec. The lowest general public service expenditures were in Alberta, British Columbia and Ontario.
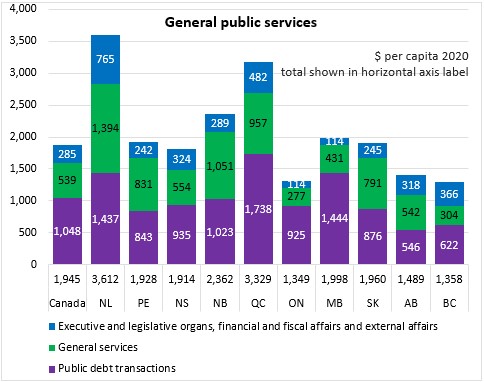
In the last year of data, Nova Scotia's consolidated provincial-local expenditures on general public services declined by 10.6% or -$227 per capita, the largest such decline among the provinces. Across Canada, provincial-local consolidated expenditures on general public services were up 0.2% or +$5 per capita. The largest increases were reported in Alberta (+14.9% or +$194 per capita) and Newfoundland and Labrador (+6.1% or +$209 per capita).
The economic affairs functional category includes expenditures in a wide range of activities. Transportation is the largest provincial-local exepnditure on economic affairs across Canada, but it is not the largest expenditure in Alberta (fuel and energy) and Saskatchewan (agriculture, forestry, fishing, hunting) and Nova Scotia (general economic/commercial/labour affairs).
Overall per capita spending on economic affairs in Nova Scotia was $1,273 - below the national average of $1,697. The highest expenditures on economic affairs were in Alberta, with its uniquely large expenditure on the economic affairs of fuel and energy. The lowest spending on economic affairs was reported in Manitoba.
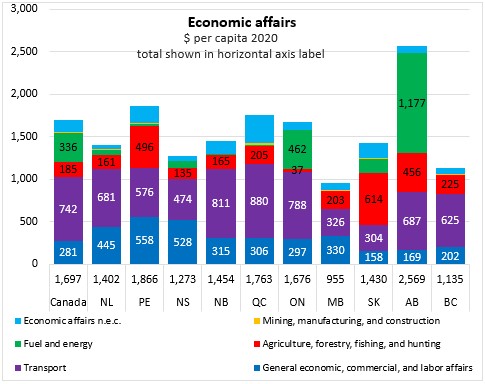
From 2019 to 2020, Nova Scotia's consolidated provincial-local expenditures on econonmic affairs (including transportation) grew by 8.6% or +$101 per capita. National expenditures grew by 8.9% or +$139 per capita. Growth was fastest in British Columbia (+42.1% or +$336 per capita) while only Prince Edward Island (-1.1% or -$21 per capita) and New Brunswick (-4.5% or -$68 per capita) reported declines.

Expenditures on public order and safety were $760 per capita in Canada and $737 per capita in Nova Scotia. Police services made up the bulk of these expenditures, followed by law courts and fire protection services. The highest expenditures on public order and safety were reported in Manitoba and Saskatchewan (where prison spending was notably higher). The lowest expenditures on public safety were in Prince Edward Island and Quebec. Nova Scotia's expenditures on public safety were about the same as the national average for police services, higher for law courts and lower for fire protection and prisons.
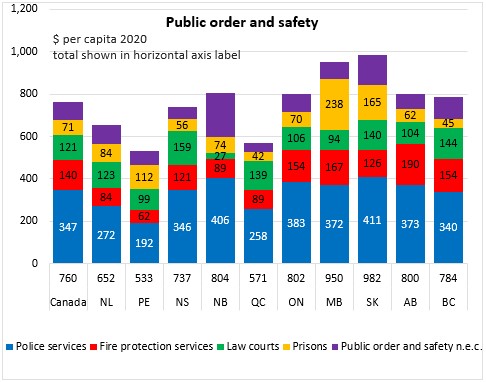
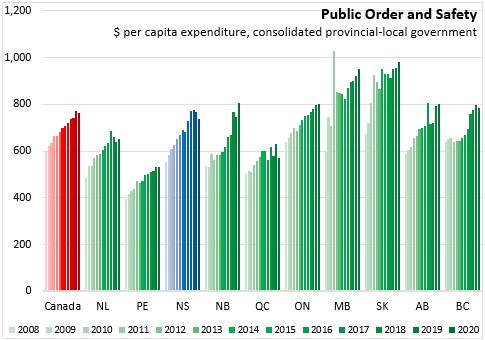
Nova Scotia's consolidated provincial-local expenditures on public order and safety fell by 3.8% or -$29 per capita from 2019 to 2020. Across Canada, these expenditures were down 1.3% or -$10 per capita. The largest decline was reported in Quebec (-9.4% or -$59 per capita) while New Brunswick (+7.6% or +$57 per capita) reported the largest increase.
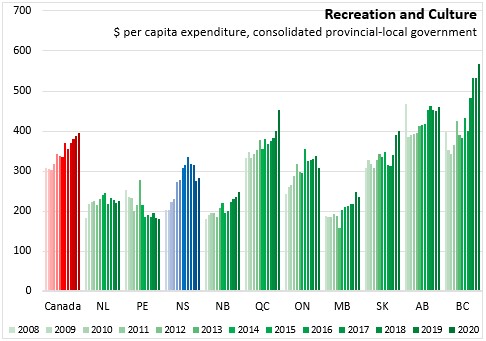
Spending on recreation and cultural services was $394 per capita across Canada and $281 per capita in Nova Scotia. Recreation and culture spending was higher in British Columbia, which has a larger expenditure on broadcasting/publishing services. Prince Edward Island had the lowest spending on recreation and cultural services.
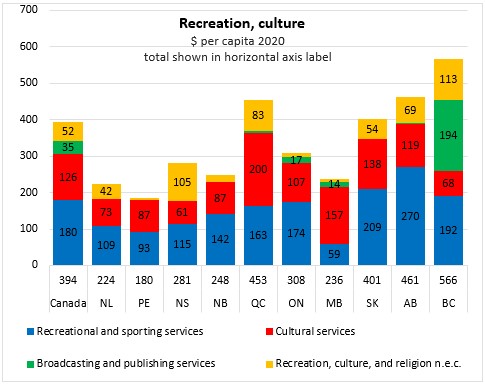
National consolidated provincial-local spending on recreation and culture was up 1.7% or +$7 per capita from 2019 to 2020. The largest gains were reported in Quebec (+13.4% or +$54 per capita) while Ontario reported the largest decline (-9.0% or -$31 per capita). Nova Scotia's expenditures on recreation and culture increased by 2.9% or +$8 per capita.
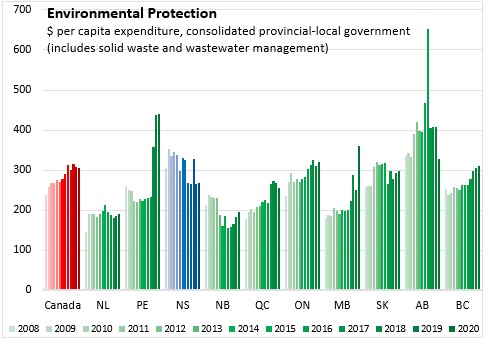
National consolidated provincial-local spending on environmental protection was $304 per capita in 2020. Nova Scotia's expenditures on environmental protection were $268 per capita. Waste management and waste water management typically make up the largest portions of national expenditures on environmental protection. Other environmental protection expenditures (n.e.c.) were higher in Manitoba; these other expenditures include administration, enforcement and data dissemination.

There was a large increase in consolidated provincial-local expenditures on environmental protection reported in Manitoba (+43.5% or +$109 per capita) while Alberta reported a substantial decline (-20.0% or -$82 per capita). Nova Scotia's expenditures increased by 1.1% or +$3 per capita while national expenditures fell 1.2% or -$4 per capita.
Consolidated provincial-local spending on housing and community amenities amounted to $237 per capita nationally and $276 per capita in Nova Scotia. Provision of water supply makes up the bulk of housing/community amenity spending in all provinces. Nova Scotia made the highest expenditures on street lighting among provinces ($41 per capita).
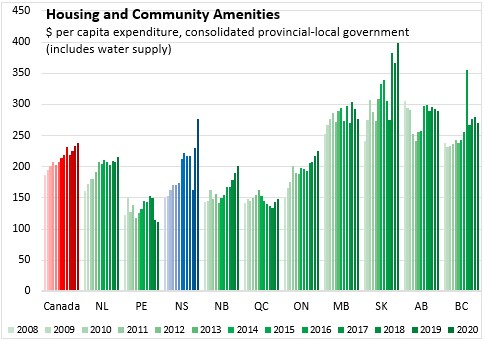
From 2019 to 2020, Nova Scotia reported the largest increase in consolidated provincial-local expenditures per capita on housing and community amenities (+20.1% or +$46 per capita). National expenditures on housing and community amenities were up 2.1% or +$5 per capita. Manitoba reported the largest decline in spending on housing and community amenities (-5.5% or -$16 per capita).
Statistics Canada. Table 10-10-0005-01 Canadian Classification of Functions of Government (CCOFOG) by consolidated government component (x 1,000,000), Table 17-10-0005-01 Population estimates on July 1st, by age and sex
<--- Return to Archive