The Economics and Statistics Division maintains archives of previous publications for accountability purposes, but makes no updates to keep these documents current with the latest data revisions from Statistics Canada. As a result, information in older documents may not be accurate. Please exercise caution when referring to older documents. For the latest information and historical data, please contact the individual listed to the right.
<--- Return to Archive
For additional information relating to this article, please contact:
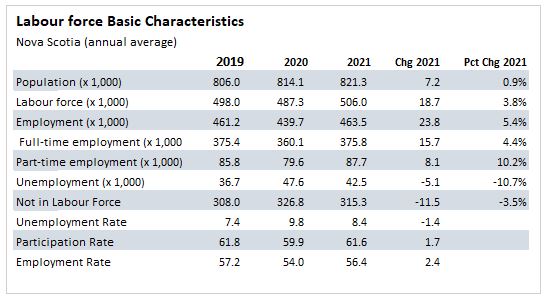
January 07, 2022LABOUR MARKET TRENDS - 2021 ANNUAL Following a 4.7% employment decline in 2020, Nova Scotia’s employment level was up 23,800 (+5.4%) in 2021 with recovery from the COVID-19 pandemic. The employment level in 2021 of 463,500 exceeds the 2019 average of 461,200 by 0.5%. Labour force increased by 18,700 (+3.8%) in 2021 when compared to 2020 and was 1.6% above 2019 levels. The unemployment rate in 2021 was 8.4% below 9.8% in 2020 and above 7.4% in 2019.
The participation rate rose 1.7 percentage points in 2021 to 61.6%, lower by 0.2 percentage points than 2019. The employment rate rose 2.4 percentage points to 56.4% in 2021, below 2019 level by 0.8 percentage points.
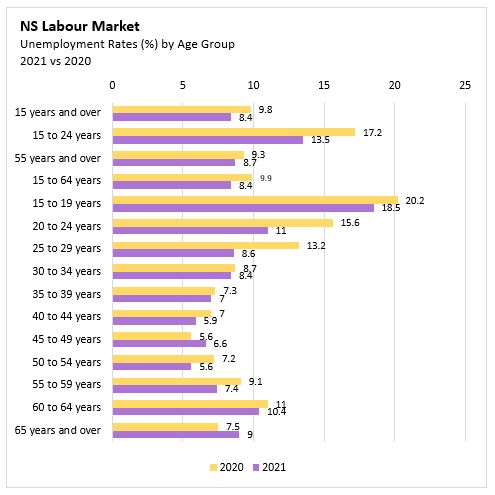
Age Cohorts
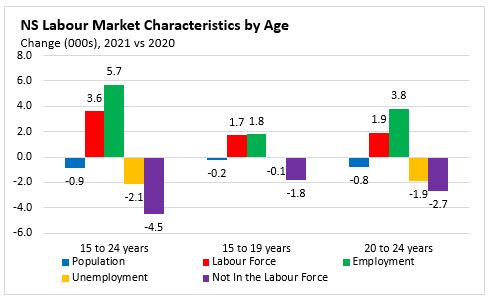
Comparing 2021 with 2020, the youth cohort (aged 15-24) saw a decrease of 900 in population along with a rise in both the labour force (+3,600, +5.1%), and employment (+5,700, +9.8%). The decrease in the number of unemployed (-2,100) pushed the unemployment rate for 15-24 years old down from 17.2% in 2020 to 13.5% in 2021. Compared to 2019 employment levels, youth employment was 2,800 lower.
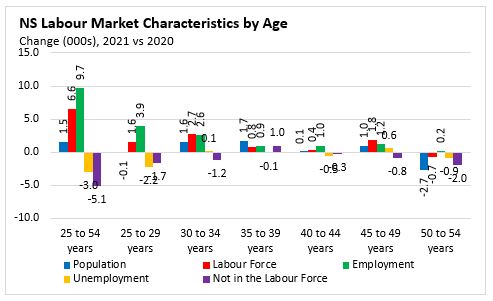
Within the 25-54 age cohort, population growth (+1,500) was accompanied by gains in both the labour force (+6,600, +2.2%) and employment (+9,700, +3.5%). The number of unemployed decreased by 3,000 (-12.1%). This resulted in the unemployment rate declining from 8.2% in 2020 to 7.0% in 2021. Compared to 2019 employment, core-aged workers employment was up 1,900.
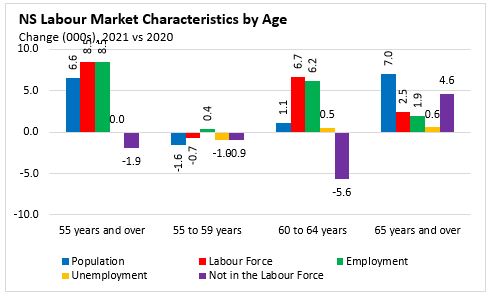
In 2021, the older cohort (aged 55+) reported an increase of 6,600 in population. The labour force was up by 8,500 (+7.4%) and employment was up by 8,500 (+8.2%) from the previous year. The number of unemployed was unchanged and there was 1,900 fewer not in the labour force. The unemployment rate declined from 9.3% in 2020 to 8.7% in 2021. Compared to 2019, the older worker employment level was 3,300 higher in 2021.
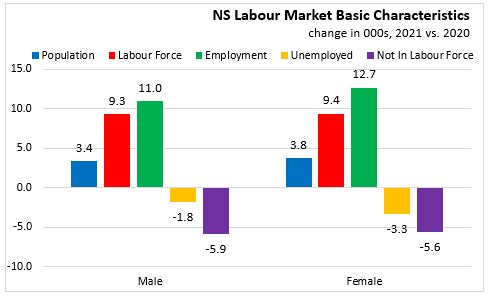
Males and Females
In 2021, Nova Scotia’s female population increased by 3,800 (+0.9%) from the previous year. With recovery from the COVID-19 pandemic, there were increases in female labour force (+9,400, +3.9%) and female employment (+12,700, +5.8%) on average in 2021. The unemployment rate for women decreased from 9.0% in 2020 to 7.3% in 2021. The female participation rate rose from 57.0% in 2020 to 58.7% in 2021. The employment rate among females was up 2.5 percentage points to 54.4% in 2021, remaining below 55.3% in 2019.
Nova Scotia’s male population was up by 3,400 (+0.9%) year-over-year in 2021. The male labour force was up by 9,300 (+3.8%) in 2021 while employment among males was up by 11,000 (+5.0%) on average in 2021 when compared to 2020. The unemployment rate fell from 10.5% to 9.4%. The male participation rate was up 1.8 percentage points to 64.7% in 2020. Among males, the employment rate rose 2.3 percentage points to 58.6% in 2021, remaining below the 59.2% in 2019.
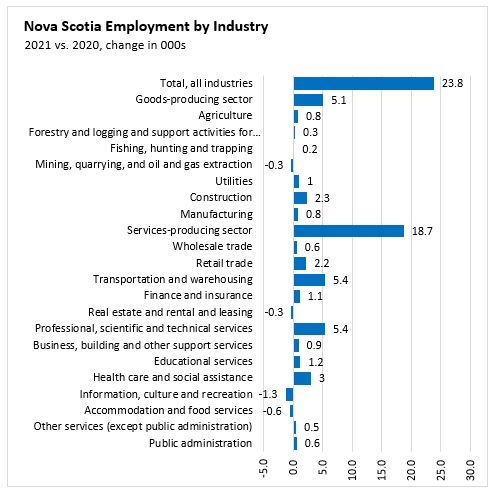
Industry and Class of Worker
Compared to 2020 levels, employment increased in the private sector (+15,800, +5.8%), public sector (+6,500, +5.7%) and the self-employed (+1,500, +2.7%). Compared to 2019, employment in the private sector (-2.5%) was lower in 2021 and higher in public sector (+6.1%) and self-employed (+4.9%).
Among goods-producing sectors, employment increased by 5,100 (+6.0%) in 2021. Employment was higher in all subsectors except mining, quarrying and oil and gas extraction. Construction employment was up 2,300 (+6.9%).
Services-producing sector was heavily impacted by the COVID-19 pandemic in 2020 with 20,100 fewer jobs compared to 2019 annual averages. In 2021, employment rose 18,700 (+5.3%). The largest employment gains in 2021 were seen in transportation/warehousing (+5,400) and professional, scientific and technical services (+5,400). Employment in real estate, rental and leasing, information (-300), culture and recreation (-1,300), and accommodation and food services (-600) declined in 2021. For 2021, employment in retail trade (-6,800), information, culture and recreation (-4,300) and accommodation and food services (-6,900) are the sectors most below 2019 levels.
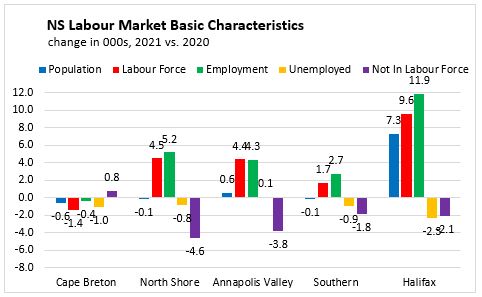
Regions
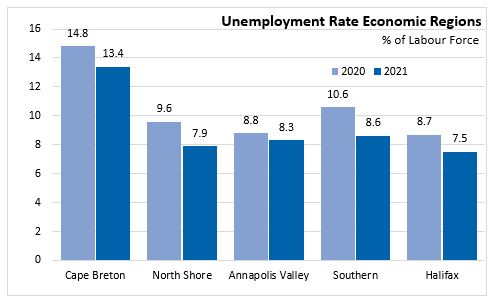
Unemployment rates fell in every economic region from 2020 to 2021.
Comparing 2021 with 2020, Cape Breton employment was down by 400 while labour force declined by 1,400. The number of unemployed decreased by 1,000 and the unemployment rate fell by 1.4 percentage points to 13.4% in 2021.
For the North Shore region, the labour force increased 4,500 while employment was up by 5,200. With the employment rise greater than the labour force, the number of unemployed decreased by 800. This resulted in a 1.7 percentage points decrease in the unemployment rate from 9.6% to 7.9%. There was 4,600 fewer persons not in the labour force in 2021.
The Annapolis Valley reported an increase of 4,400 in the labour force and 4,300 in employment. The number of unemployed was up 100 and the number not in the labour force declined 3,800 in 2021. The unemployment rate decreased 0.5 percentage points to 8.3%.
The Southern region had an increase of 1,700 in the labour force and 2,700 in employment. This caused the number of unemployed to decrease by 900. As a result, the unemployment rate fell from 10.6% in 2020 to 8.6% in 2021.
Halifax experienced an increase of 9,600 in the labour force with a LFS population increase of 7,300. Employment was up 11,900 in Halifax in 2021.The number unemployed declined 2,300 and there was 2,100 fewer persons not in the labour force. The unemployment rate in Halifax fell 1.2 percentage points from 8.7% in 2020 to 7.5% in 2021.
Provincial Comparisons
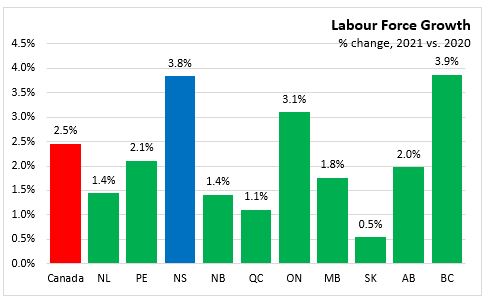
Both the labour force and employment increased in all provinces in 2021.
In Canada, the labour force was up 2.5% year-over-year in 2021. The largest increase was in British Columbia (+3.9%) and Nova Scotia (+3.8%). Saskatchewan had the smallest increase at 0.5%.
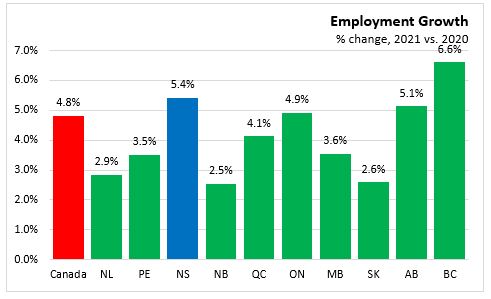
Canada’s employment grew 4.8% in 2021. Among provinces, British Columbia (+6.6%) and Nova Scotia (+5.4%) reported the largest increases. New Brunswick (+2.5%) and Saskatchewan (+2.6%) smallest gains.
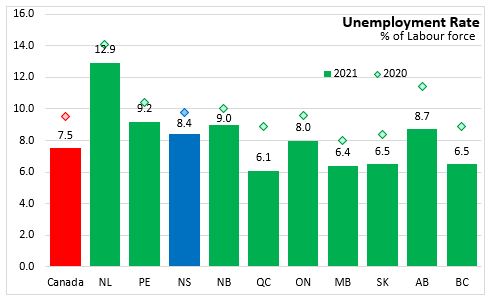
The Nova Scotia unemployment rate stood at 8.4% in 2021, above the national average of 7.5%. Newfoundland and Labrador (12.9%) reported the highest unemployment and Quebec (6.1%) reported the lowest unemployment rate in 2021.
National Comparisons: Cities
The unemployment rate for the Halifax Census Metropolitan Area (CMA) was 7.5% in 2021 down from 8.7% in 2020, but higher than 5.8% in 2019. The unemployment rate was down across all CMAs in 2021, except St. Catharines-Niagara where it was unchanged. Quebec (4.2%) reported the lowest unemployment rate and St. Catharines-Niagara (9.8%) had the highest.

The employment rate for the Halifax CMA was 62.9% in 2021, up 2.0 percentage points from 2020 and 1.2 percentage points from 2019. In 2021, Belleville, Ontario (53.0%) had the lowest employment rate while Guelph, Ontario (65.6%) had the highest.

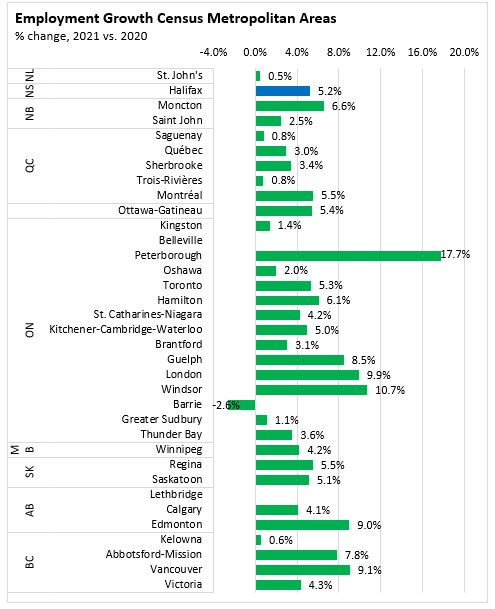
Halifax’s employment increased 5.2% in 2021. Among the CMAs, employment declined only in Barrie (-2.6%). The largest increase was in Peterborough (+17.7%).
Sources:
Statistics Canada. Table 14-10-0327-01 Labour force characteristics by sex and detailed age group, annual
Statistics Canada. Table 14-10-0385-01 Labour force characteristics, CMAs, annual
Statistics Canada. Table 14-10-0393-01 Labour force characteristics, Economic Regions annual
Statistics Canada. Table 14-10-0023-01 Labour force characteristics by industry, annual (x 1,000)
Statistics Canada. Table 14-10-0027-01 Employment by class of worker, annual (x 1,000)
<--- Return to Archive