The Economics and Statistics Division maintains archives of previous publications for accountability purposes, but makes no updates to keep these documents current with the latest data revisions from Statistics Canada. As a result, information in older documents may not be accurate. Please exercise caution when referring to older documents. For the latest information and historical data, please contact the individual listed to the right.
<--- Return to Archive
For additional information relating to this article, please contact:
January 28, 2022HOUSEHOLD INCOME AND CONSUMPTION, Q3 2021 As part of its new quarterly data for Distribution of Household Economic Accounts, Statistics Canada is now providing quarterly data on household income, household final consumption expenditures and household wealth. This information is available for provinces as well as for income quintiles and age groups.
These quarterly results supplement previously-available provincial data for compensation of employees and investment in fixed capital stock. These concepts align with the Provincial and Territorial Economic Accounts, but they remain subject to revision in future releases.
Household Income
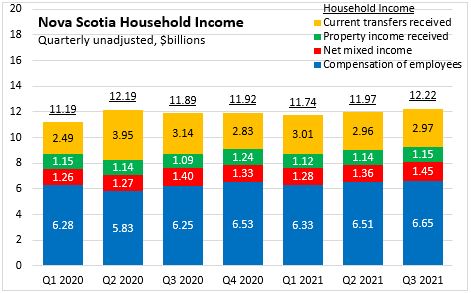
In addition to compensation of employees, household income also includes net mixed income (generated from unincorporated businesses), property income received (generated as the result of ownership of assets) and current transfers received (generally from government).
In Q3 2021, Nova Scotia's household income rose to $12.2 billion. All components of household income rose for the quarter. Current transfers remained elevated in Q3 2021 compared to Q1 2020.
Through the first three quarters of 2021 (compared with the same period in 2020), employee compensation grew by 6.1% in Nova Scotia. National compensation grew 9.1% with the fastest growth in Ontario and the slowest in Newfoundland and Labrador.

Net mixed income has continued to grow in 2021, up by 4.2% in Nova Scotia over the first three quarters of the year (compared with the same period in 2020). National net mixed income was up 5.0% across Canada with the fastest growth in Quebec and Ontario and the slowest growth in Saskatchewan.

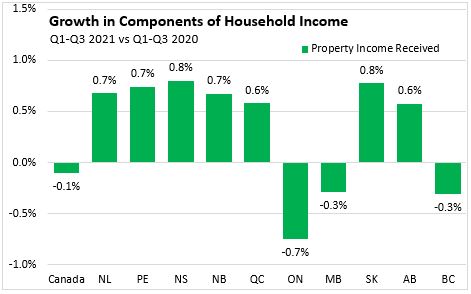
Year to date, property income received is up 0.8% in Nova Scotia compared to the same period in 2020. Property income grew in seven provinces in the first three quarters of the year, led by Nova Scotia and Saskatchewan. Nationally, property income is down 0.1% in the first three quarters of the year, with the largest decline in Ontario.
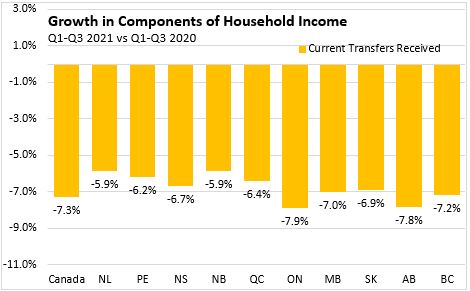
Improving economic conditions in 2021 has allowed many emergency transfer arrangements to be wound down. Through the first three quarters of 2021, current transfers received were down 6.7% in Nova Scotia and 7.3% nationally. The least declines in transfers were in Newfoundland and Labrador and New Brunswick, while transfers are down more in Ontario and Alberta.
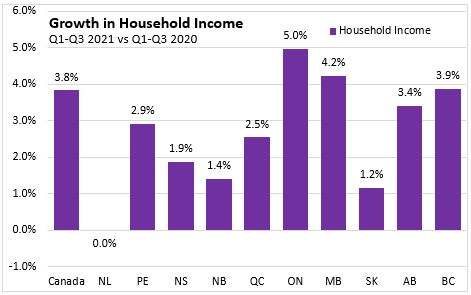
Through the first three quarters of 2021, household income was up 1.9% in Nova Scotia as declines in transfers were offset by growth in employee compensation, net mixed income and property income. Household income growth was 3.8% nationally with faster growth in Ontario, Manitoba and British Columbia. Newfoundland and Labrador was the only province to report unchanged household income so far in 2021.
Household Final Consumer Expenditures
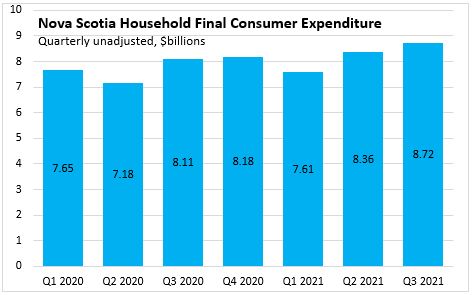
Nova Scotia's household final consumer expenditures fell in Q2 2020 but rebounded in Q3 and Q4 of 2020. After a dip in Q1 2021 (which may be attributable to seasonal consumption patterns), Nova Scotia's consumer spending has increased to over $8.7 billion in Q3 2021.
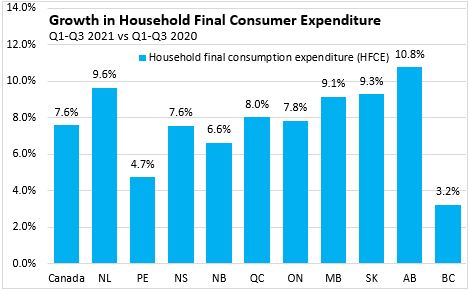
Through Q3 of 2021, consumer spending was up for all provinces. Nova Scotia's consumer spending grew by 7.6% compared to the first three quarters of 2020. Consumer spending increased fastest in Alberta and Newfoundland and Labrador. The slowest growth was reported in British Columbia and Prince Edward Island.
Quarterly consumption spending fell significantly in Q2 2020 for all provinces. All provinces reported sharp rebounds in Q3 2020 followed by smaller gains in Q4 2020. Consumer spending fell again in Q1 2021 before rebounding in Q2 2021 (these data are not adjusted for seasonal patterns). Growth continued at a slower pace for all provinces in Q3 2021.

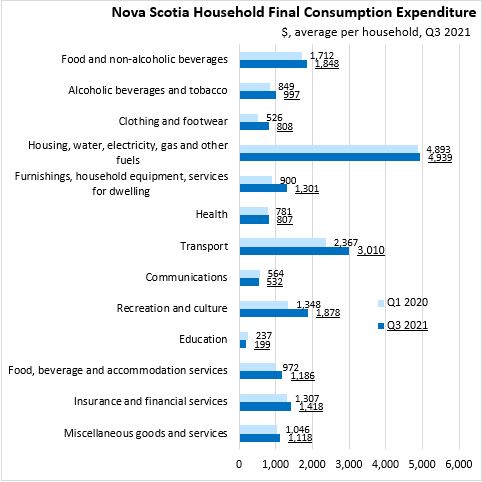
The largest consumer expenditure category is housing, water, electricity, gas and other fuels, followed by transport. Average quarterly household expenditure has gone up in Nova Scotia in all categories since the first quarter of 2020 (to proxy pre-pandemic spending) except education and communication, which have declined.
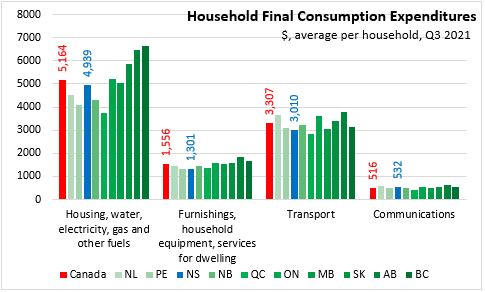
Nova Scotians spend more on housing and utilities than other Atlantic provinces, but less than the national average per household in Q3 2021. Nova Scotia households spend less than the national average in most expenditure categories, except communications and alcohol and tobacco, on which Nova Scotians spend more, on average.


Source: Statistics Canada. Table 36-10-0663-01 Distributions of household economic accounts, income, consumption and saving, Canada, provinces and territories, quarterly (x 1,000,000)
<--- Return to Archive