The Economics and Statistics Division maintains archives of previous publications for accountability purposes, but makes no updates to keep these documents current with the latest data revisions from Statistics Canada. As a result, information in older documents may not be accurate. Please exercise caution when referring to older documents. For the latest information and historical data, please contact the individual listed to the right.
<--- Return to Archive
For additional information relating to this article, please contact:
March 16, 2022ANALYSIS OF NOVA SCOTIA'S CONSUMER PRICE INDEX FOR FEBRUARY 2022 TRENDS – February 2022
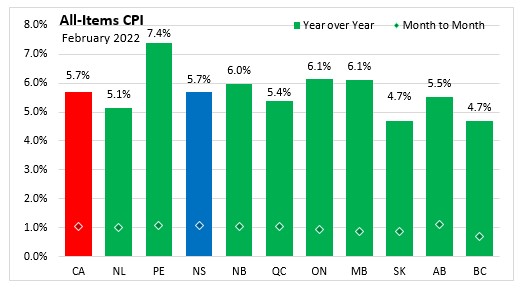
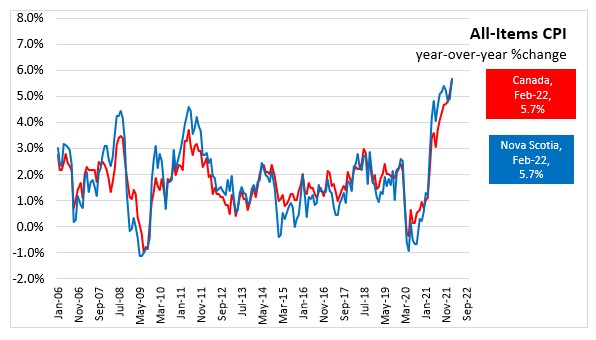
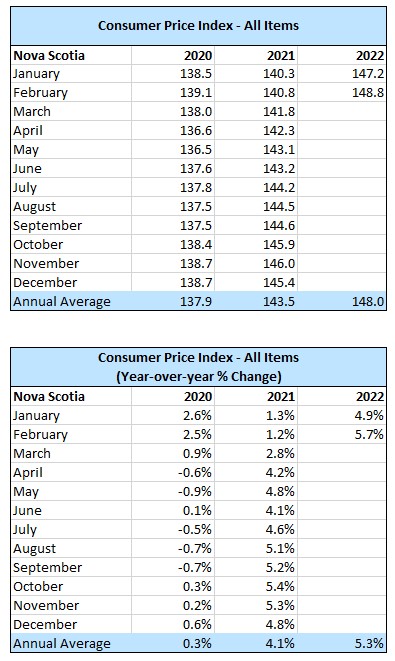
Nova Scotia’s All-Items Consumer Price Index (CPI) increased 5.7% year-over-year in February 2022, up from the 4.9% year-over-year increase in January. Nationally, consumer prices were up 5.7% from a year earlier. The national increase was the largest gain since August 1991 and the second consecutive month where headline inflation exceeded the 5.0% mark.
Statistics Canada noted that the increases were broad based among components with higher gasoline and food prices leading the rise. Reflecting rising input and transportation costs, prices for food purchased from stores increased 7.4% year-over-year in February. This was the highest gain since May 2009. Price growth for meat (+11.7%), including fresh or frozen beef (+16.8%) and chicken (+10.4%), was higher year over year in February than in January.
Shelter prices (+6.6%) rose at there fastest pace since August 1983 with new home prices contributing to higher costs for homeowners' upkeep and replacement costs.
Gasoline prices rose 6.9% on monthly basis in Canada with concerns over global oil supplies amid international political events. Gasoline prices paid were 32.3% more than February 2021.
Impact of COVID-19 on the Consumer Price Index
Due to COVID-19 restrictions some components in some areas for the spectator entertainment indexes were imputed in this months CPI.
Inflation was highest in Prince Edward Island (+7.4%) while Saskatchewan and British Columbia had the lowest, both at 4.7%. Compared to the previous month, all provinces had increases in the CPI index in February 2022 including Nova Scotia (+1.1%).
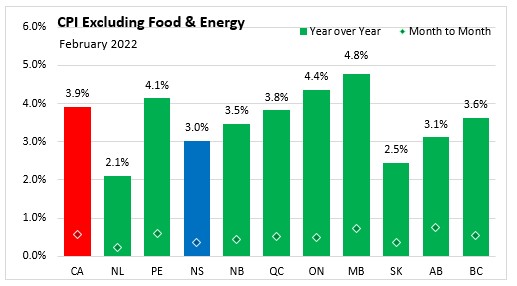
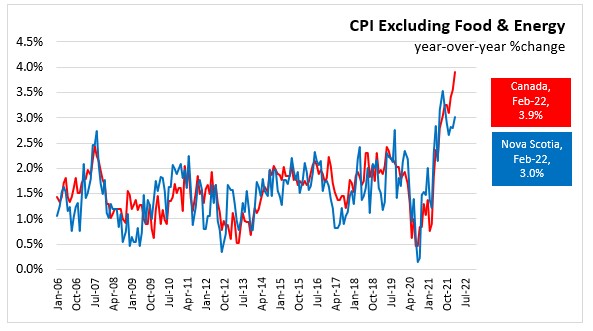
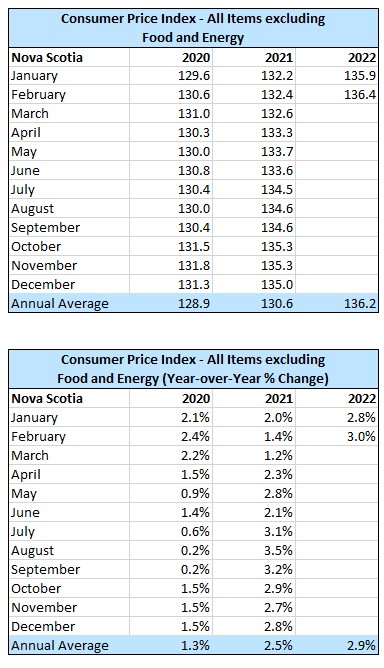
Nova Scotia’s consumer price inflation (year-over-year) excluding food and energy increased 3.0% in February 2022. Consumer prices excluding food and energy were up in all provinces led by Manitoba (4.8%). Newfoundland and Labrador had the smallest increase at 2.1%.
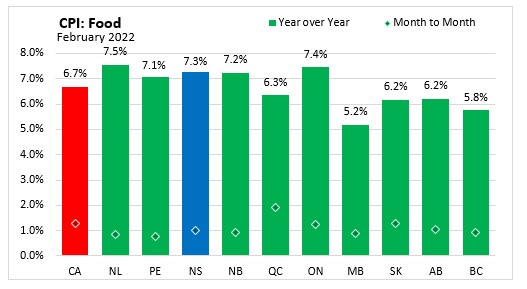
The CPI for food in Nova Scotia increased 7.3% year-over-year in February 2022. Nationally, food prices were up 6.7% from a year earlier. All provinces recorded year-over-year increase in food prices led by Newfoundland and Labrador (+7.5%). Manitoba had the lowest increase at 5.2%.
Compared to the previous month, food prices in Nova Scotia were up 1.0%, below the national average of 1.3%. All provinces recorded seasonally unadjusted month-over-month gains in food prices in February.
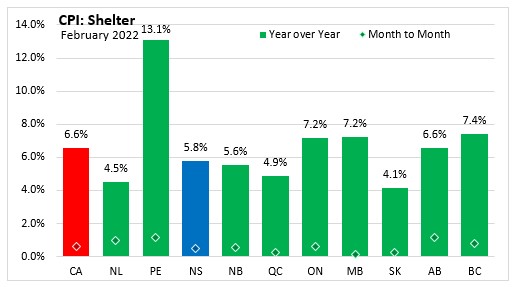
Year-over-year, shelter costs in Nova Scotia increased 5.8% in February 2022, below the national average increase of 6.6%. Compared to February 2021, shelter prices were up in all provinces with the largest increase in Prince Edward Island (+13.1%) and the smallest increase in Saskatchewan (+4.1%).
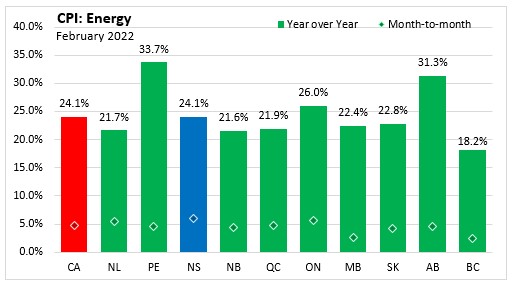
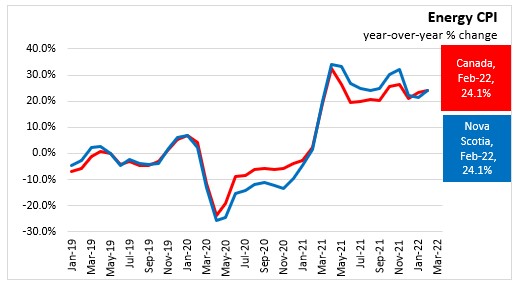
Nova Scotia's consumer price inflation (year-over-year growth in CPI) for energy was 24.1% in February, same as the national average. Prince Edward Island (+33.7%) and Alberta (+31.3%) posted the largest year-over-year increases while British Columbia (+18.2%) had the smallest change in the energy index. On a monthly basis, the seasonally unadjusted energy index was up in all provinces.
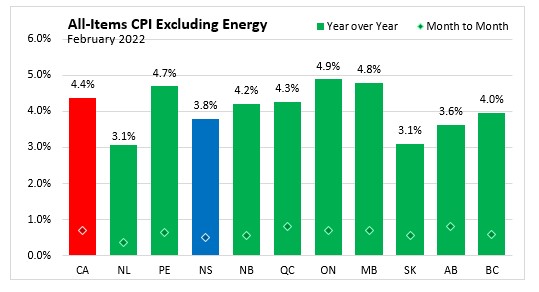
Nova Scotia's consumer price inflation (year-over-year growth in CPI) excluding energy was 3.8% in February compared to a national rate of 4.4%. Ontario (+4.9%) posted the largest year-over-year gain while Newfoundland and Labrador and Saskatchewan (both +3.1%) had the smallest change in the CPI excluding energy.
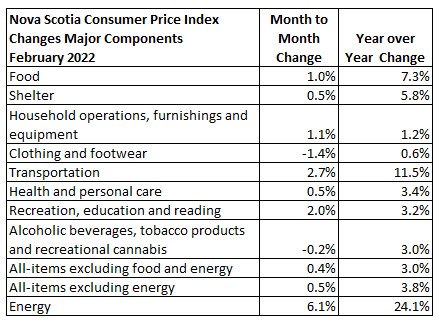
Major Components for February 2022
The following table shows the price increases specific to Nova Scotia for the major components of the CPI this month.
The main contributors to the monthly change (February 2022 vs January 2022) in Nova Scotia CPI were:
- Gasoline (+8.7%)
- Fuel oil and other fuels (+8.1%)
- Household textile (+18.7%)
- Rent (-1.1%)
- Paper, plastic and aluminum foil supplies (-4.5%)
- Clothing accessories, watches and jewellery (-4.85)
The main contributors to the yearly change (February 2022 vs February 2021) in Nova Scotia CPI were:
- Gasoline (+32.9%)
- Fuel oil and other fuels (+40.7%)
- Purchase and leasing of passenger vehicles (+4.8%)
- Telephone services (-10.5%)
- Mortgage interest cost (downward contribution, percent change not available)
- Travel tours (downward contribution, percent change not available)
Long Run Trends
In February 2022, the all-items CPI year-over-year inflation rate for Nova Scotia was 5.7%, matching the national inflation rate. Month-to-month movements in the indices can be different, but over time they generally follow the same overall trend. Nova Scotia’s all-items CPI increase of 5.7% in February was the largest increase since March 2003 (+6.9%).
Nova Scotia’s CPI excluding food and energy increased 3.0%, higher than the 2.8% year-over-year increase reported the previous month. Canada CPI excluding food and energy rose 0.4 percentage points from 3.5% to 3.9%. The NS CPI excluding food and energy was previously above or near 3% in 2003.
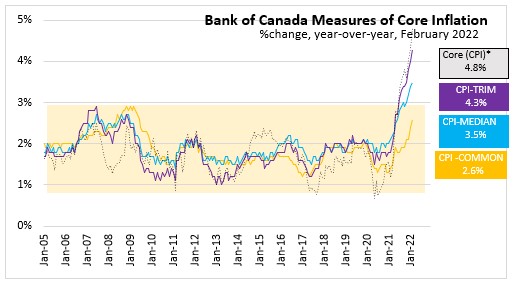
Bank of Canada's preferred measures of core inflation
Compared to February 2021, CPI-Common increased 2.6%, CPI-Median increased 3.5% and CPI-Trim was up 4.3% in Canada. All-items CPI excluding eight of the most volatile components as defined by the Bank of Canada and excluding the effect of changes in indirect taxes (formerly referred to as CPIX), rose 4.8% year-over-year. The change in the core inflation measures was up 0.2 percentage points for CPI-common, up 0.1 percentage points for CPI-median and up 0.3 percentage points for CPI-trim from the previous 12-month period.
Appendix Tables and Charts
Basket Update
With the June 2020 release the CPI basket of goods and services has been updated. The new basket weights are based on 2020 expenditure data, in which spending would reflect pre-pandemic patterns (Jan-Feb), an economy mostly in lockdown (March-June), and the emergence of new consumption patterns as economy re-opened (July-December). Statistics Canada notes that the "The data reflect shifts in spending due to the COVID-19 pandemic that will likely take some time to stabilize across goods and services, and geographic regions" and the June 2021 headline CPI for Canada would be the same if the previous basket weights (2017) were used. The weights for shelter (+2.86 percentage points), households operations, furnishings and equipment (+2.23 percentage points), and alcoholic beverages, tobacco products and recreational cannabis (+1.7 percentage points) are higher in the 2020 basket while transportation had the largest decline falling from a 19.72% share to 15.34% share. New products classes were added for shipping fees and local delivery fees (including restaurant and grocery delivery fees), digital subscriptions services to magazines, and video game consoles. Further information on the update can be found in An Analysis of the 2021 Consumer Price Index Basket Update, Based on 2020 Expenditures
Source: Statistics Canada. Table 18-10-0004-01 Consumer Price Index, monthly, not seasonally adjusted; Table 18-10-0256-01 Consumer Price Index (CPI) statistics, measures of core inflation and other related statistics - Bank of Canada definitions
<--- Return to Archive