The Economics and Statistics Division maintains archives of previous publications for accountability purposes, but makes no updates to keep these documents current with the latest data revisions from Statistics Canada. As a result, information in older documents may not be accurate. Please exercise caution when referring to older documents. For the latest information and historical data, please contact the individual listed to the right.
<--- Return to Archive
For additional information relating to this article, please contact:
May 10, 2022CANADIAN SOCIAL ENVIRONMENT TYPOLOGY Statistics Canada has recently published a new geographic classification tool called the Canadian Social Environment Typology (CanSET). This tool provides neighbourhood classifications based on combinations of 30 socioeconomic, demographic and ethnocultural variables from the 2016 Census of Population.
Each neighbourhood type is a group of dissemination areas having similar social characteristics and can be used to measure health and social inequalities by comparing outcomes among similar as well as different types of neighbourhoods within a city or among cities in Canada. The CanSET was developed by Statistics Canada in collaboration with the Urban Public Health Network in Canada.
Statistics Canada also released a study along with the CanSET data tool that explores variations in age-standardized COVID-19 mortality rates by socioeconomic, demographic and ethnocultural characteristics of six neighbourhood types in Canada. This article provides an overview of neighbourhood level inequalities in COVID-19 mortality rates in Canada.
The CanSET classification tool classifies dissemination areas (DA) of Canada's Census metropolitan areas and Census agglomerations into neighbourhood types. Each type is based on similarities across 30 socioeconomic, demographic and ethnocultural variables from the 2016 Census of population. The CanSET tool was used to understand inequalities in COVID-19 mortality rates in 2020 by six neighbourhood types in Canada namely: 1) High socio economic status (SES) suburban neighbourhoods 2) Low SES suburban neighbourhoods 3) Senior or institutionalized population neighbourhoods 4) High SES urban neighbourhoods 5) Multicultural dense urban neighbourhoods and 6) Large city South/East Asian concentrated neighbourhoods.
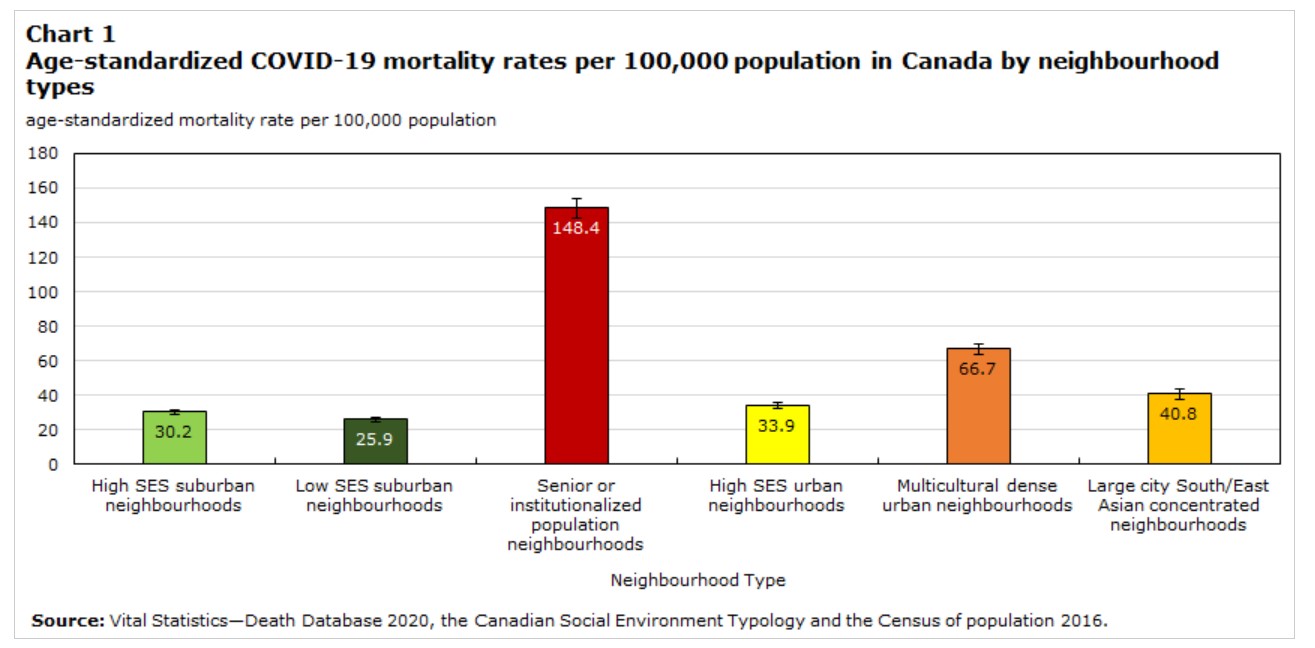
Senior or institutionalized population neighbourhoods reported the highest age-standardized COVID-19 mortality rate in 2020 at 148.4 deaths per 100,000 population. These neighbourhoods are characterized by low income households having higher proportion of elderly population living in an institutional collective dwelling such as a senior home, a hospital or a long-term care home.
The densely populated urban neighbourhoods characterised by very high proportion of immigrants, lone parent families and low-income families (i.e., multicultural dense urban neighbourhoods) has the second highest age-standardized COVID-19 mortality rate at 66.7 deaths per 100,000 population in 2020.
The lowest age-standardized mortality rate was reported in low socioeconomic status (SES) suburban neighbourhoods at 25.9 deaths per 100,000 population. Low SES suburban neighbourhoods generally have lower population density and smaller household size compared to other neighbourhood cluster types.
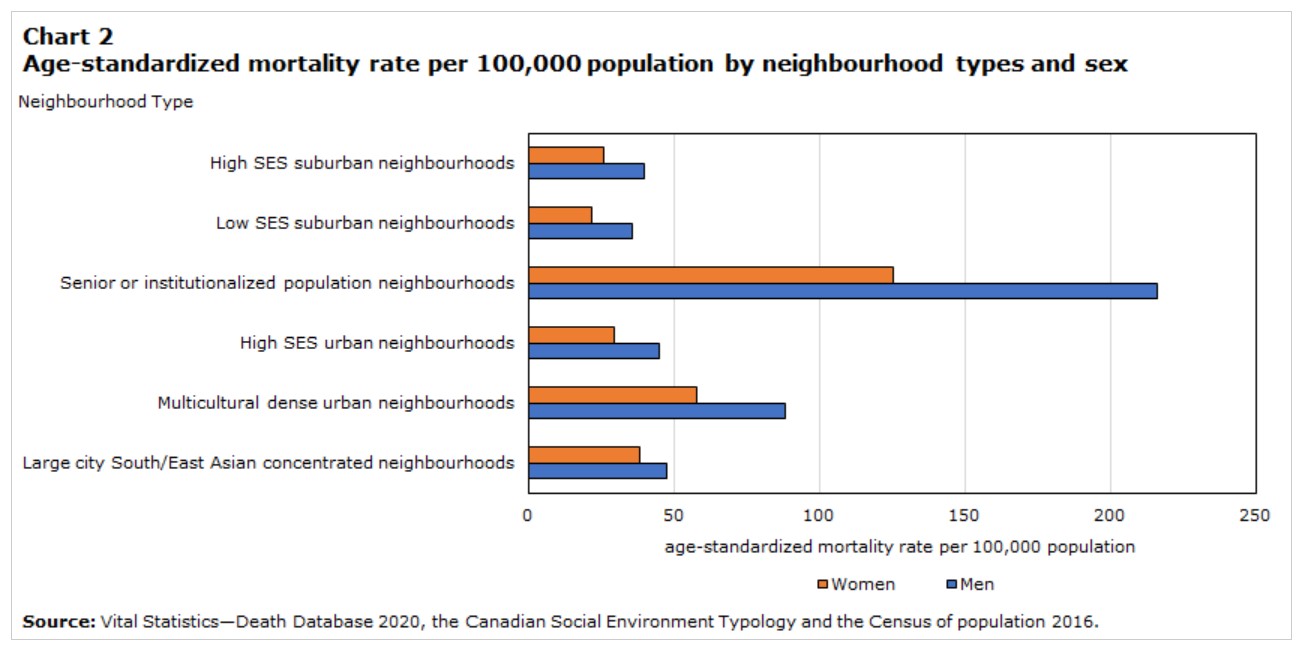
Men had higher age-standardized COVID-19 mortality rates compared with women across all neighbourhood types in Canada in 2020. The largest difference in mortality between men and women was found in the senior or institutionalized population neighbourhoods (216.1 deaths for men vs 125.0 deaths for women per 100,000 population).
Large city South/East Asian concentrated neighbourhoods reported the lowest gap between mortality rates for men (47.3 deaths per 100,000 population) and women (37.9 deaths per 100,000 population).
Definitions:
High socioeconomic status (SES) suburban neighbourhoods: Neighbourhoods in this cluster have medium population density but higher than average number of people per household; lower than average proportion of single parent families; high proportion of households with a university degree at bachelor's level or above; low unemployment rate and higher than average household income; higher than average proportion of people in managerial or professional occupations; high dwelling ownership rate and low proportion of households in need of major repair.
Low SES suburban neighbourhoods: Neighbourhoods in this cluster have relatively low population density; lower than average number of people per household but higher than average proportion of single parent families; very low proportion of households with a university degree at bachelor's level or above; very low proportion of recent immigrant population but higher than average proportion of Aboriginal population; relatively high proportion of labour force in manufacturing, and sales and service occupations; relatively low median dwelling value and low adjusted family income.
Senior or institutionalized population neighbourhoods: Neighbourhoods in this cluster have very small household size; very low proportion of population 14 years of age and under, but very high proportion of elderly population aged 65 years and above; very high proportion of institutionalized population; very high proportion of low-income households; very high proportion of government transfer of payment recipients; low dwelling ownership rate; and very low adjusted family income.
High SES urban neighbourhoods: Neighbourhoods in this cluster have very high population density and very low proportion of children 14 years of age and under; very small household size; very low proportion of labour force in manufacturing occupations but high proportion of population in professional occupations; higher than average proportion of households with a university degree; very low dwelling ownership rate and very high proportion of population spending more than 30% of income on housing costs; and higher than average dwelling value. Most of these DAs are located in the provinces of Quebec, Ontario, Alberta and British Columbia.
Multicultural dense urban neighbourhoods: Neighbourhoods in this cluster have very high population density; relatively high proportion of population 14 years of age and under; very high proportion of lone parent families and very high proportion of government transfer of payment recipients; high unemployment rate; very high proportion of immigrants and recent immigrant population; high proportion of labour force working in sales and service related occupations; very low dwelling ownership rate; and very low adjusted family income. DAs in this cluster are mostly from the provinces of Quebec, Ontario and Alberta.
Large city South/East Asian concentrated neighbourhoods: Neighbourhoods in this cluster have high population density; very large household size; very high proportion of immigrant population and very high proportion of visible minorities of South and East Asian origin; very high proportion of the population not speaking either of the official languages of Canada; and very high dwelling value. DAs in this cluster are mostly from the Montréal, Toronto, Calgary and Vancouver CMAs.
Source: Statistics Canada; Canadian Social Environment Typology: A new way to help measure health and social inequalities in Canada, 2020, Inequalities in COVID-19 mortality rates by neighbourhood types in Canada
<--- Return to Archive