The Economics and Statistics Division maintains archives of previous publications for accountability purposes, but makes no updates to keep these documents current with the latest data revisions from Statistics Canada. As a result, information in older documents may not be accurate. Please exercise caution when referring to older documents. For the latest information and historical data, please contact the individual listed to the right.
<--- Return to Archive
For additional information relating to this article, please contact:
September 08, 2022STATISTICS CANADA ETHNOCULTURAL AND REGIONAL POPULATION PROJECTIONS 2016-2041 Statistics Canada has released another set of population projections. These new projections reflect new near-term immigration targets established by Immigration, Refugees and Citizenship Canada. Statistics Canada's projections also provide outlooks for regions (in Nova Scotia this is Halifax and the rest of the province) as well as racialized populations based on the visible minority categories from the 2016 Census. These projections are not a forecast of the most likely population changes in the future, but rather an examination of how populations might change under different scenarios of immigration (levels and provincial distribution), emigration, non-permanent residents, life expectancy and interprovincial migration. Of note, none of the Statistics Canada scenarios presented reflect recent patterns of interprovincial migration (which increased substantially for Nova Scotia from 2016-2022).
Statistics Canada's regional and ethnocultural population projection scenarios are based on the following assumptions:
Reference: A medium immigration rate of 8.3 immigrants per 1,000 inhabitants at the end of the projection; a provincial or territorial distribution of new immigrants upon arrival corresponding to the values observed in 2021 at the beginning of the projection and gradually converging toward the average distribution estimated between 2007 and 2021, reaching it at the end of the projection; a distribution of new immigrants by place of birth corresponding to the values observed on average between 2017 and 2021 and gradually converging to the average distribution estimated for 2007 to 2021, reaching it at the end of the projection; a medium gross migraproduction rate of net emigration reaching 1.5 emigrants per 1,000 inhabitants at the end of the projection; a medium increase in the number of non-permanent residents to 1,556,000 at the end of the projection; a total fertility rate of 1.40 children per woman in 2020, which rises to 1.59 children per woman at the end of the projection; a constantly increasing life expectancy, reaching 84.8 years for men and 88.4 years for women in 2041; internal migration patterns representative of the estimated average over the following five-year periods: 1996 to 2001, 2001 to 2006, 2006 to 2011 and 2011 to 2016.
Low immigration: Same assumptions as the reference scenario except that the immigration rate evolves to 6.5 immigrants per 1,000 inhabitants in 2041.
High immigration: Same assumptions as the reference scenario except that the immigration rate is kept constant at 11.9 immigrants per 1,000 inhabitants.
Alternative geographic distribution of immigrants upon arrival scenario: Same assumptions as the reference scenario except that the geographical distribution converges toward the average distribution estimated over the period 2017 to 2021 by 2041.
Alternative immigration composition by place of birth scenario: Same assumptions as the reference scenario except that the geographical origin of immigrants is representative of the average distribution observed between 2017 and 2021 throughout the projection.
Low growth scenario: Same assumptions as the reference scenario except for the following five assumptions: A low immigration rate of 6.5 immigrants per 1,000 inhabitants at the end of the projection; a high gross migraproduction rate of net emigration reaching 1.7 emigrants per 1,000 inhabitants at the end of the projection; an increase in the number of non-permanent residents at the beginning of the projection followed by a slow decrease thereafter to 1,031,000 at the end of the projection; a total fertility rate of 1.40 children per woman in 2020, which decreases to 1.28 children per woman in 2027 and then increases to 1.40 children per woman at the end of the projection; a relatively slow rise in life expectancy, reaching 83.5 years for men and 87.4 years for women in 2041.
High growth scenario: Same assumptions as the reference scenario except for the following five assumptions: A high immigration rate kept constant at 11.9 immigrants per 1,000 inhabitants; a low gross migraproduction rate of net emigration reaching 1.2 emigrants per 1,000 inhabitants at the end of the projection; a high increase in the number of non-permanent residents to 1,947,000 at the end of the projection; a total fertility rate of 1.40 children per woman in 2020, which rises to 1.79 children per woman at the end of the projection; a relatively rapid rise in life expectancy, reaching 85.8 years for men and 89.6 years for women in 2041.
Alternative internal migration scenarios (4): These four scenarios make the same assumptions as the reference scenario, but alter interprovincial migration to align with observed patterns from: 1996-2001, 2001-2006, 2006-2011 and 2011-2016.
The projections start from the 2016 Census results and estimate actual populations from 2016-2021 with Statistics Canada's Demosim tool.
Under Statistics Canada's 2016-2041 population projections, Nova Scotia's overall population in 2041 is projected to range from 890,000 (low-growth) to 1,026,000 (high-growth). Note that Statistics Canada's projections do not include the more recent data showing that Nova Scotia's population is already estimated to exceed 1,000,000.

Halifax's population under Statistics Canada's scenarios is projected to rise as high as 541,000 in 2041 under the high-growth scenario; in the low-growth scenario, Halifax's population falls to 455,000.

In all of Statistics Canada's scenarios, the population outside of Halifax is projected to fall. In the high-growth scenario, the population outside Halifax falls to 485,000 by 2041 while in the low growth scenario, it falls to 435,000.

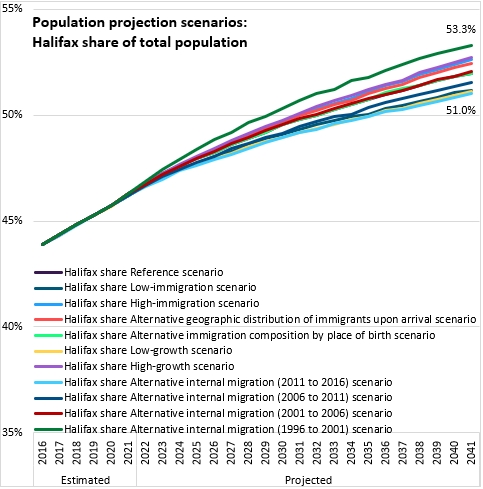
In every one of Statistics Canada's scenarios, Halifax's share of the provincial population rises to over 50% by 2041 (ranging from 51.0%-53.3%).
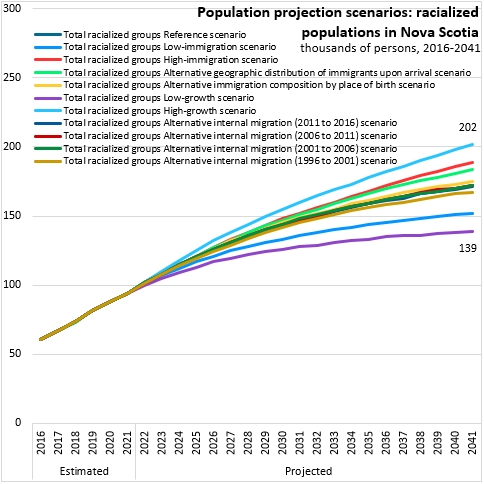
Statistics Canada's population projections for 2016-2041 use the visible minority categories from the 2016 Census to estimate populations of racialized persons for each scenario. Note that visible minority categories refer only to non-Indigenous populations. In Nova Scotia, the largest groups of racialized persons were: Black, South Asian, Chinese, Arab and Filipino.
Under every Statistics Canada scenario of 2016-2041 population growth, the number of racialized persons in Nova Scotia grows, ranging from 139,000 in 2041 (low-growth) to 202,000 in 2041 (high-growth).
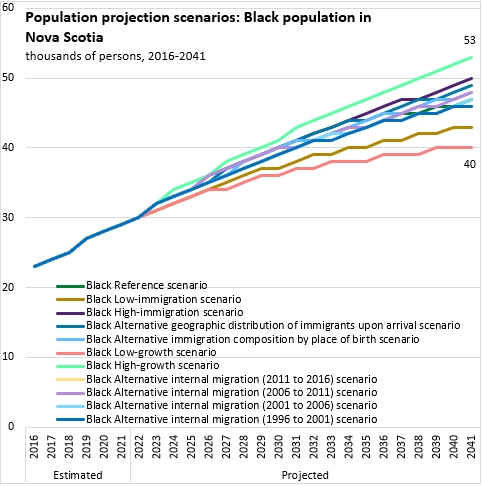
Under each of Statistics Canada's scenarios, the Black population of Nova Scotia is projected to rise, ranging from 40,000 in 2041 to 53,000 in 2041.
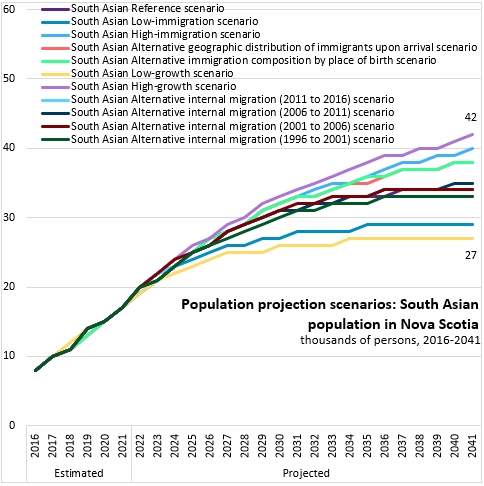
Nova Scotia's South Asian population is projected to grow, falling within a range of 27,000 to 42,000 by 2041.
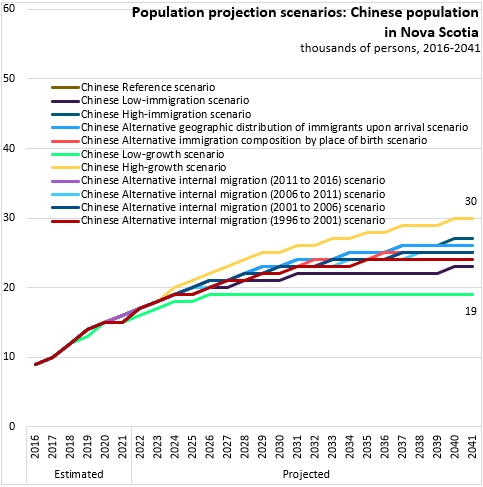
The Chinese population could reach as high as 30,000 by 2041 under Statistics Canada's high-growth scenario. Under Statistics Canada's low-growth scenario, Nova Scotia's Chinese population is projected to plateau at 19,000 from 2026-2041.
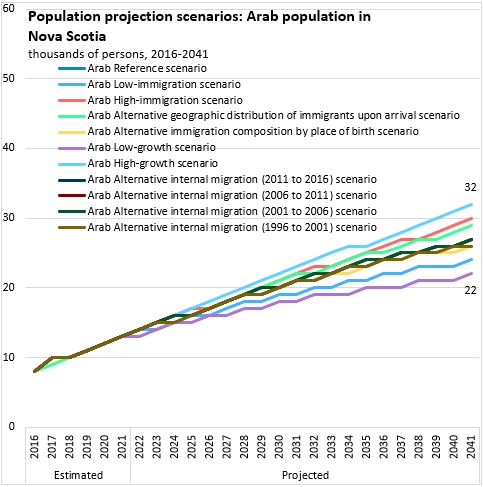
As with other racialized groups, Statistics Canada projects that the Arab population of Nova Scotia will rise to between 22,000 and 32,000 by 2041.
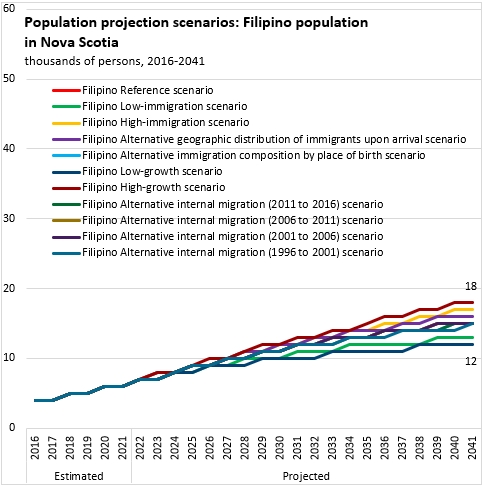
Statistics Canada projects that Nova Scotia's Filipino population will grow in each of its scenarios, reaching between 12,000 and 18,000 by 2041.
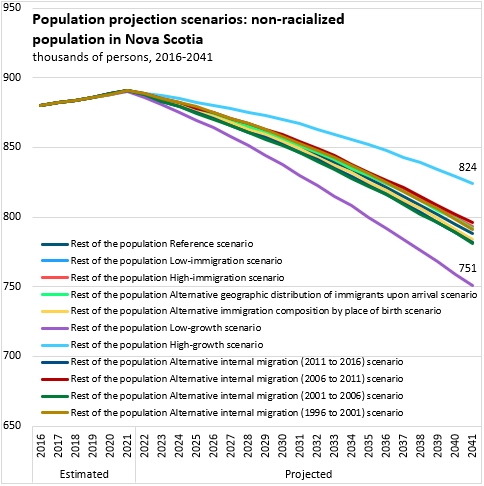
Statistics Canada's population projections indicate a declining number of non-racialized persons in Nova Scotia across each of its scenarios.
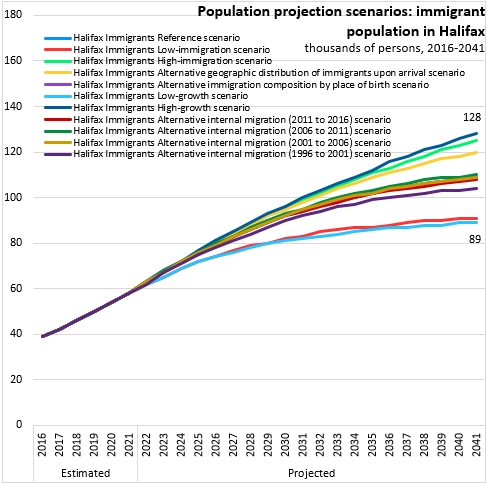
Statistics Canada's population projections for 2016-2041 also estimate the number of immigrants residing in Nova Scotia. By 2041, Statistics Canada projects that the immigrant population of Nova Scotia will rise to between 113,000 and 162,000.

A disproportionately larger share of immigrants are projected to reside in Halifax under every one of Statistics Canada's scenarios.
In contrast, even Statistics Canada's high-growth scenario sees the number of immigrants living in Nova Scotia outside Halifax rising to just 34,000. Under Statistics Canada's low growth scenario, the number of immigrants living in Nova Scotia outside Halifax remains stable at 24,000 by 2041.

Source: Statistics Canada. Table 17-10-0146-01 Projected population by racialized group, generation status and other selected characteristics (x 1,000); Population projections on immigration and diversity for Canada and its regions, 2016 to 2041: Overview of projection assumptions and scenarios
<--- Return to Archive