The Economics and Statistics Division maintains archives of previous publications for accountability purposes, but makes no updates to keep these documents current with the latest data revisions from Statistics Canada. As a result, information in older documents may not be accurate. Please exercise caution when referring to older documents. For the latest information and historical data, please contact the individual listed to the right.
<--- Return to Archive
For additional information relating to this article, please contact:
September 27, 2022INFRASTRUCTURE: SOCIAL HOUSING AND RECREATION, 2020 Statistics Canada has released new infrastructure data on publicly owned social/affordable housing as well as culture/sport/recreation assets for 2020.
SOCIAL AND AFFORDABLE HOUSING (2020)
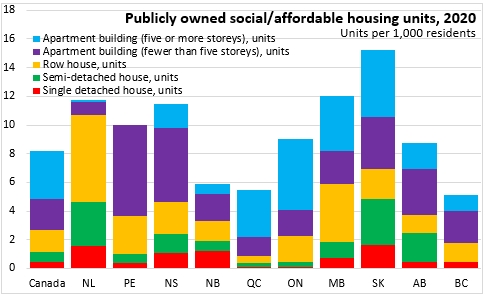
Statistics Canada reports that there were just over 11,000 publicly-owned social/affordable housing units in Nova Scotia in 2020. This amounted to 11.46 units per 1,000 residents. This was above the national average of 8.22 units per 1,000 residents. The highest number of social/affordable housing units per 1,000 residents was in Saskatchewan while the lowest numbers were reported in British Columbia and Quebec.

In the composition of social and affordable housing in Nova Scotia, the largest portion of units were apartments in buildings of under 5 stories. Nova Scotia and Prince Edward Island both reported a higher share of their social and affordable housing stock in these low-rise buildings. Apartments in high rise buildings made up a notably larger share of social and affordable housing units in Quebec, Ontario, Manitoba, and Saskatchewan.
CULTURE, SPORT AND RECREATION FACILITIES, 2020
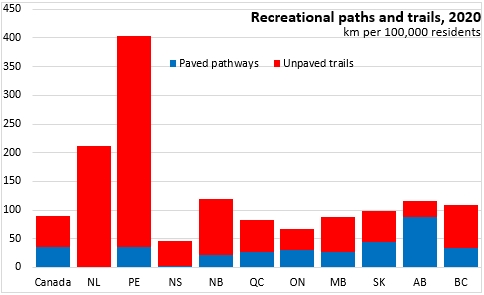
Statistics Canada has also released inventories of culture, sport and recreation facilities. Figures below refer only to publicly-owned culture, sport and recreation facilities and all are stated on the basis of facilities per 100,000 residents (except paths and trails which are stated as kilometers per 100,000 residents).
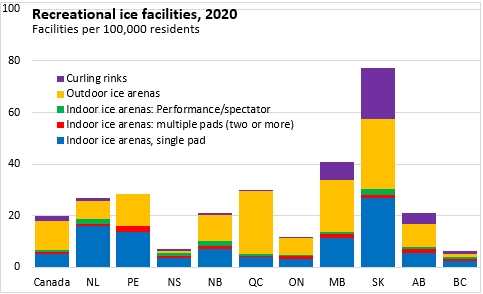
Compared with the national average, Nova Scotia had among the fewest ice arena facilities per 100,000 residents. Saskatchewan had the most ice arenas by a margin - particularly for curling rinks. British Columbia and Nova Scotia had the fewest ice arenas per 100,000 residents. Note that these data do not distinguish multiple pad rinks based on the size of ice surface provided.
Nova Scotia had the fewest recreational pool assets per 100,000 residents. Saskatchewan also reported the largest number of publicly-owned pool assets per 100,000 residents, notably for spray parks/splash pads and outdoor pools.

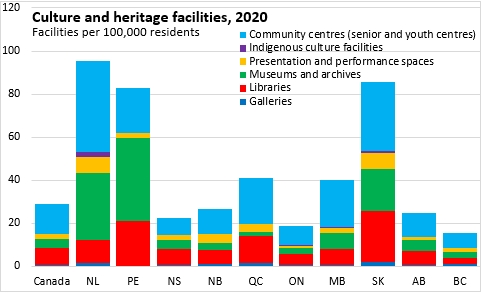
Nova Scotia reported a lower-than average number of culture and heritage assets per 100,000 residents (including galleries, libraries, museums, performance spaces, Indigenous cultural facilities and community centres). The largest numbers of culture and heritage facilities per 100,000 residents were reported in Newfoundland and Labrador while the smallest numbers were reported in Ontario and British Columbia.
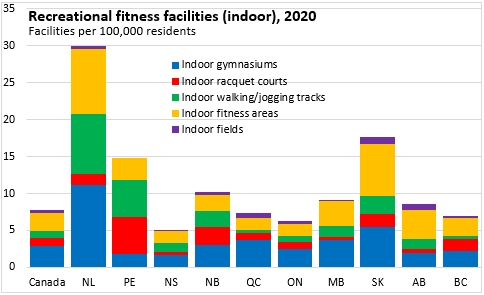
Nova Scotia reported the fewest indoor recreation facilities (gyms, courts, tracks, fields, fitness areas) per 100,000 residents among provinces. Newfoundland and Labrador reported the largest number of indoor recreation facilities per 100,000 residents.
Nova Scotia also reported the lowest number of outdoor recreation facilities (specialty areas, playgrounds, courts, ball diamonds, sports fields). Saskatchewan reported the largest number of outdoor facilities per 100,000 residents.

Nova Scotia reported the fewest kilometers of pathways per 100,000 residents. Prince Edward Island reported the most.
Sources: Statistics Canada. Table 46-10-0001-01 Inventory of publicly owned social and affordable housing assets, Infrastructure Canada; Table 34-10-0065-01 Inventory of publicly owned culture, recreation and sport facilities, Infrastructure Canada; Table 17-10-0005-01 Population estimates on July 1st, by age and sex
<--- Return to Archive