The Economics and Statistics Division maintains archives of previous publications for accountability purposes, but makes no updates to keep these documents current with the latest data revisions from Statistics Canada. As a result, information in older documents may not be accurate. Please exercise caution when referring to older documents. For the latest information and historical data, please contact the individual listed to the right.
<--- Return to Archive
For additional information relating to this article, please contact:
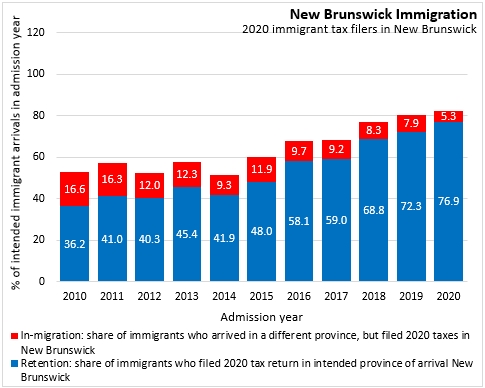
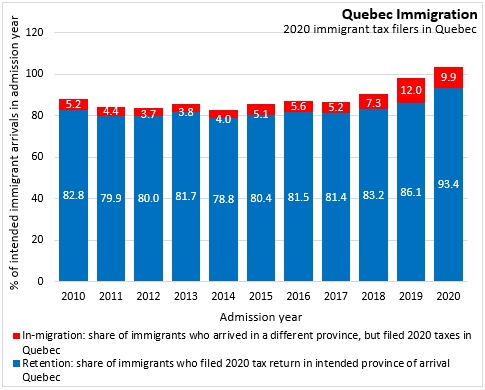
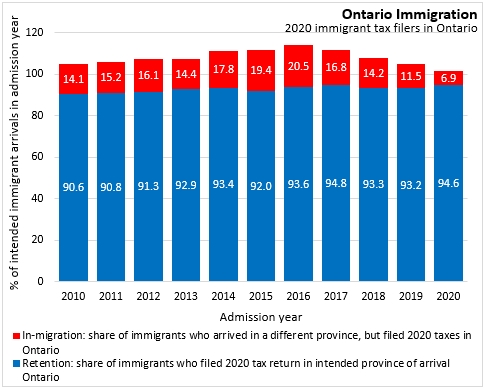
December 12, 2022MOBILITY OF IMMIGRANTS WITHIN CANADA: 2010-2020 Statistics Canada has released tables from the Longitudinal Immigration Database on the wages and location of immigrants who arrived in Canada up to 2020. This data allows comparison of the number of immigrants who arrived in each province with their subsequent location, based on where they filed their income tax returns. 'Retention rate' in Statistics Canada's analysis refers to the proportion of tax filers that remained in their intended province of arrival, which can differ from their actual province of arrival.
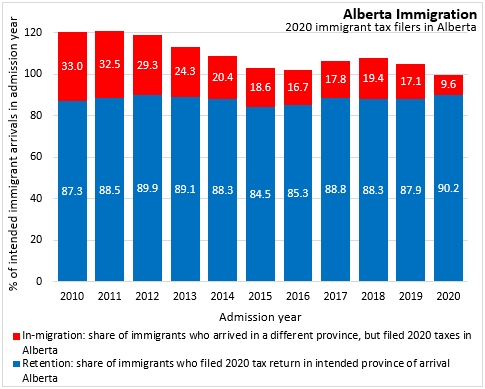
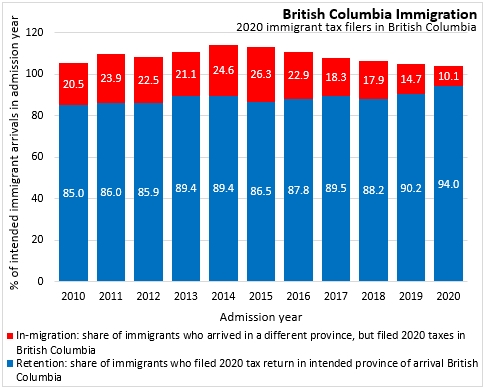
This data showed that the number of 2010-2020 immigrants who filed taxes in Nova Scotia 2020 was 81.8% of the total number of immigrants whose intended province of arrival was Nova Scotia in this period. This includes both immigrants that remained in Nova Scotia as well as those who moved to Nova Scotia after arriving in a different province. The number of immigrant taxfilers was above 100% in Ontario, Alberta and British Columbia over this period - implying that more immigrants moved to these provinces than left over that period. Prince Edward Island reported the lowest portion of immigrants filing taxes in 2020.
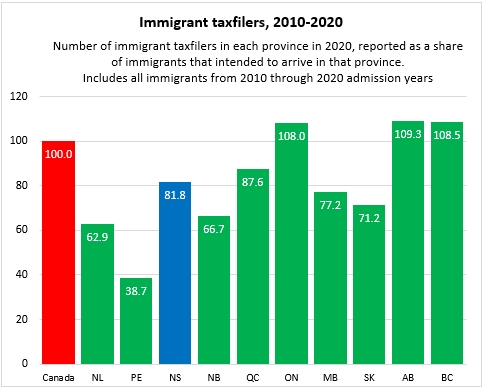


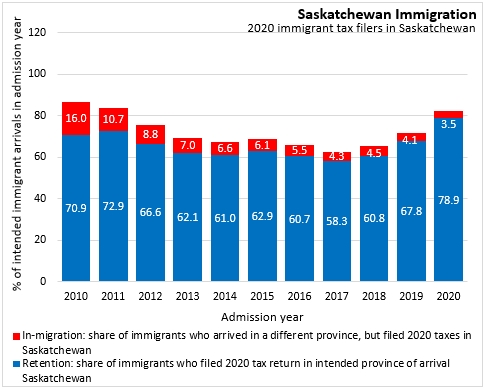
Note that the figure for each province in the first chart is the weighted average (weighted by the number of intended immigrant arrivals for a given admission year) of the sum of retention and in-migration for each of the 11 admission years.
Statistics Canada. Table 43-10-0017-01 Interprovincial migration of immigrant taxfilers, by admission year and tax year, for Canada and provinces; Table 43-10-0018-01 Interprovincial migration of immigrant taxfilers, by pre-admission experience and tax year, for Canada and provinces
<--- Return to Archive