The Economics and Statistics Division maintains archives of previous publications for accountability purposes, but makes no updates to keep these documents current with the latest data revisions from Statistics Canada. As a result, information in older documents may not be accurate. Please exercise caution when referring to older documents. For the latest information and historical data, please contact the individual listed to the right.
<--- Return to Archive
For additional information relating to this article, please contact:
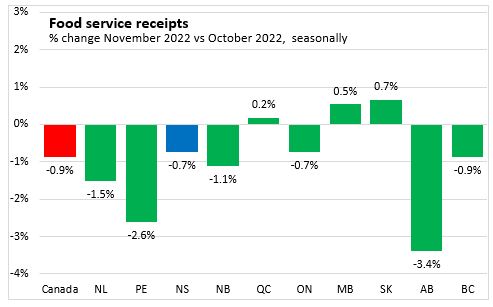
January 26, 2023FOOD SERVICES AND DRINKING PLACES, NOVEMBER 2022 Month-over-Month (November 2022 vs October 2022, seasonally adjusted)
Nova Scotia food services and drinking places receipts decreased 0.7% to $172.9 million. Canada's food services and drinking places receipts declined 0.9% to $7.3 billion. Three provinces reported monthly increases in receipts for food services and drinking places, with Saskatchewan reporting the largest gain and Alberta recording the largest decline.
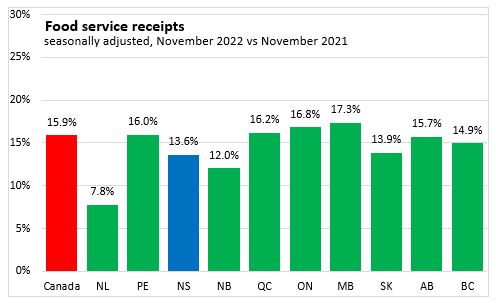
Year-over-year (November 2022 vs November 2021)
Nova Scotia food services and drinking places receipts increased 13.6%. Canada's food services and drinking places receipts increased 15.9%. All provinces reported year-over-year increases in food services and drinking place receipts, with Manitoba and Ontario reporting the largest gains. Newfoundland and Labrador reported the smallest gain.
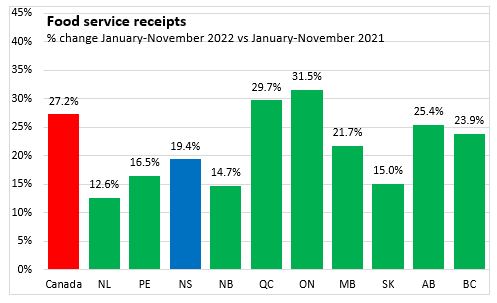
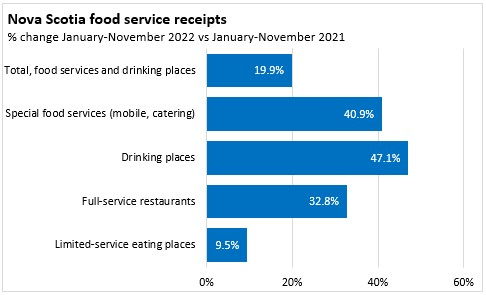
Year-to-date (January - November 2022 vs January - November 2021)
Nova Scotia food services and drinking places receipts increased 19.4%. Canada's food services and drinking places receipts increased 27.2%. All provinces reported year-to-date increases in food services and drinking place receipts, with Ontario and Quebec reporting the largest gains and Newfoundland and Labrador reporting the smallest gain.
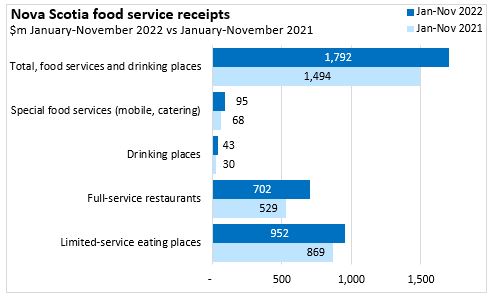
Nova Scotia's year-to-date gains in food service receipts are primarily attributable to the increases in limited service eating places as well as full-service restaurants. In percentage terms, however the gains were faster for drinking places and special food services.
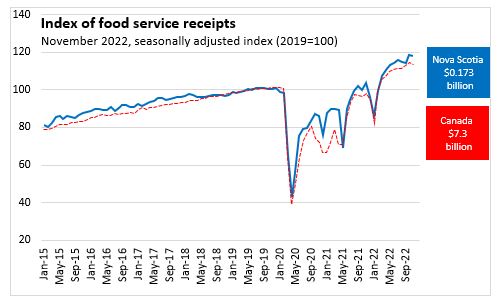
Trends
Food services and drinking places have reported repeated downturns during imposition of COVID restrictions. As these restrictions eased, food service receipts have rebounded, and Nova Scotia has surpassed its pre-pandemic levels.
Source: Statistics Canada. Table 21-10-0019-01 Monthly survey of food services and drinking places (x 1,000)
<--- Return to Archive